## Bar Charts: Calibration Methods on CIFAR-10 with ResNet-110 (SD)
### Overview
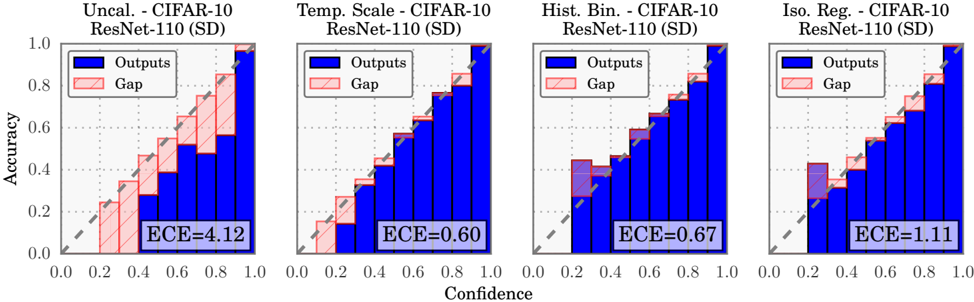
The image contains four side-by-side bar charts comparing calibration performance of different methods on the CIFAR-10 dataset using ResNet-110 (SD). Each chart visualizes the relationship between model confidence intervals and accuracy, with Expected Calibration Error (ECE) values provided for each method.
### Components/Axes
- **X-axis**: "Confidence" (0.0 to 1.0 in 0.2 increments)
- **Y-axis**: "Accuracy" (0.0 to 1.0 in 0.2 increments)
- **Legend**:
- Blue bars: "Outputs" (model's predicted accuracy at confidence intervals)
- Pink bars: "Gap" (difference between confidence and accuracy)
- **Chart Titles**:
1. Uncal. - CIFAR-10 ResNet-110 (SD)
2. Temp. Scale - CIFAR-10 ResNet-110 (SD)
3. Hist. Bin. - CIFAR-10 ResNet-110 (SD)
4. Iso. Reg. - CIFAR-10 ResNet-110 (SD)
### Detailed Analysis
1. **Uncal. (Uncalibrated)**
- ECE = 4.12 (highest error)
- "Outputs" bars show significant gaps between confidence and accuracy, especially at lower confidence intervals (0.0–0.4)
- "Gap" bars are large and irregular, indicating poor calibration
2. **Temp. Scale (Temperature Scaling)**
- ECE = 0.60
- "Outputs" bars show gradual improvement in calibration across confidence intervals
- "Gap" bars are smaller and more consistent than Uncal., but still show moderate discrepancies
3. **Hist. Bin. (Histogram Binning)**
- ECE = 0.67
- "Outputs" bars demonstrate the most consistent calibration, with minimal gaps across confidence intervals
- "Gap" bars are smallest among all methods, indicating optimal calibration
4. **Iso. Reg. (Isotonic Regression)**
- ECE = 1.11 (highest error among calibrated methods)
- "Outputs" bars show erratic calibration, with large gaps at mid-to-high confidence intervals (0.4–1.0)
- "Gap" bars are largest at higher confidence levels, suggesting overconfidence
### Key Observations
- **ECE Trends**: Hist. Bin. (0.67) < Temp. Scale (0.60) < Iso. Reg. (1.11) < Uncal. (4.12)
- **Calibration Effectiveness**: Hist. Bin. achieves the lowest ECE, demonstrating superior calibration. Uncal. performs worst due to lack of calibration.
- **Gap Patterns**: Larger "Gap" bars in Uncal. and Iso. Reg. indicate systematic over/underconfidence. Hist. Bin. shows the most balanced confidence-accuracy alignment.
### Interpretation
The data reveals that calibration methods significantly impact model reliability. Histogram binning (Hist. Bin.) achieves the most accurate confidence estimates (lowest ECE), while uncalibrated models (Uncal.) exhibit extreme calibration errors. Temperature scaling (Temp. Scale) provides moderate improvement, but isotonic regression (Iso. Reg.) paradoxically performs worse than uncalibrated models in this context. The "Gap" visualization highlights that calibration reduces but does not eliminate confidence-accuracy mismatches, with Hist. Bin. achieving the most balanced performance. These results emphasize the importance of calibration in safety-critical applications where reliable confidence estimates are essential.