## Line Chart: Critic Rewards Mean
### Overview
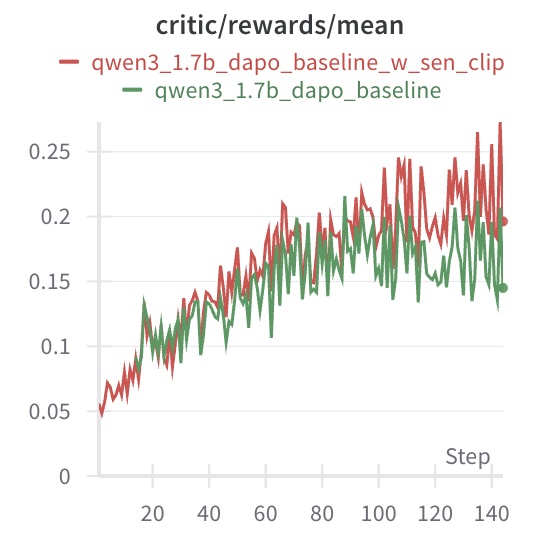
This image presents a line chart displaying the mean rewards over steps for two different models: `qwen3_1.7b_dapo_baseline_w_sen_clip` and `qwen3_1.7b_dapo_baseline`. The chart visualizes the performance of these models as training progresses, measured by the average reward received at each step.
### Components/Axes
* **Title:** `critic/rewards/mean` - Located at the top-center of the chart.
* **X-axis:** `Step` - Located at the bottom-center of the chart. The scale ranges from 0 to 140, with tick marks at intervals of 20.
* **Y-axis:** No explicit label, but represents the mean reward. The scale ranges from 0 to 0.25, with tick marks at intervals of 0.05.
* **Legend:** Located at the top-right of the chart.
* `qwen3_1.7b_dapo_baseline_w_sen_clip` - Represented by a red line.
* `qwen3_1.7b_dapo_baseline` - Represented by a green line.
### Detailed Analysis
* **qwen3\_1.7b\_dapo\_baseline\_w\_sen\_clip (Red Line):** The red line generally slopes upward from Step 0 to approximately Step 80, then fluctuates with a generally stable mean.
* Step 0: Approximately 0.04
* Step 20: Approximately 0.12
* Step 40: Approximately 0.17
* Step 60: Approximately 0.20
* Step 80: Approximately 0.22
* Step 100: Approximately 0.23
* Step 120: Approximately 0.24
* Step 140: Approximately 0.26
* **qwen3\_1.7b\_dapo\_baseline (Green Line):** The green line also slopes upward from Step 0 to approximately Step 80, but exhibits more fluctuation than the red line.
* Step 0: Approximately 0.06
* Step 20: Approximately 0.13
* Step 40: Approximately 0.16
* Step 60: Approximately 0.18
* Step 80: Approximately 0.19
* Step 100: Approximately 0.18
* Step 120: Approximately 0.16
* Step 140: Approximately 0.15
### Key Observations
* Both models show an increasing trend in mean rewards during the initial training phase (Steps 0-80).
* The `qwen3_1.7b_dapo_baseline_w_sen_clip` model (red line) consistently achieves higher mean rewards than the `qwen3_1.7b_dapo_baseline` model (green line) throughout the entire training process.
* The red line exhibits less variance in rewards after Step 80 compared to the green line.
* The green line shows a slight decrease in rewards towards the end of the training period (Steps 120-140).
### Interpretation
The chart demonstrates the learning progress of two models, likely during reinforcement learning training. The `critic/rewards/mean` metric indicates how well the models are performing in receiving positive feedback (rewards) from the environment. The consistently higher rewards of the `qwen3_1.7b_dapo_baseline_w_sen_clip` model suggest that the addition of "w\_sen\_clip" (potentially a sensor clipping mechanism) improves the model's performance. The initial upward trend for both models indicates that they are learning and improving their strategies. The stabilization of the red line after Step 80 suggests that the model may be converging towards an optimal policy, while the continued fluctuations of the green line indicate that it may still be exploring and refining its strategy. The slight decline in the green line's rewards at the end could indicate overfitting or the need for further training.