## Bar Charts: Calibration Performance of ResNet-110 (SD) on CIFAR-100
### Overview
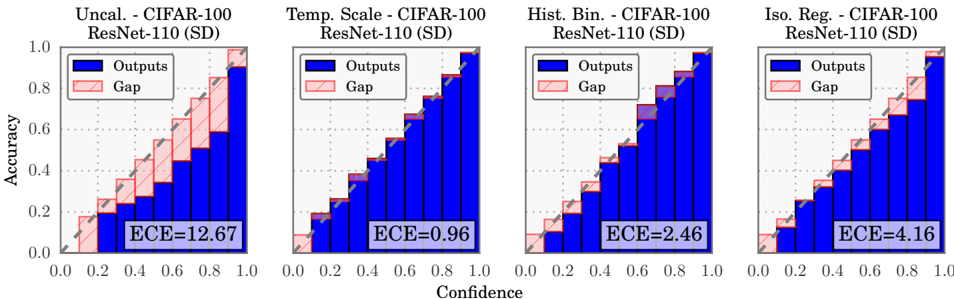
The image contains four side-by-side bar charts comparing calibration methods for a ResNet-110 (SD) model trained on the CIFAR-100 dataset. Each chart evaluates a different calibration technique: **Uncal.** (uncalibrated), **Temp. Scale** (temperature scaling), **Hist. Bin.** (histogram binning), and **Iso. Reg.** (isotonic regression). The charts visualize the relationship between model confidence and accuracy, with error bars representing uncertainty.
---
### Components/Axes
- **X-axis (Confidence)**: Ranges from 0.0 to 1.0 in increments of 0.2. Labeled "Confidence."
- **Y-axis (Accuracy)**: Ranges from 0.0 to 1.0 in increments of 0.2. Labeled "Accuracy."
- **Legend**:
- **Blue bars**: "Outputs" (model accuracy at given confidence levels).
- **Pink bars**: "Gap" (difference between confidence and accuracy).
- **Chart Titles**:
- Top-left: "Uncal. - CIFAR-100 ResNet-110 (SD)"
- Top-center-left: "Temp. Scale - CIFAR-100 ResNet-110 (SD)"
- Top-center-right: "Hist. Bin. - CIFAR-100 ResNet-110 (SD)"
- Top-right: "Iso. Reg. - CIFAR-100 ResNet-110 (SD)"
- **ECE Values**: Embedded in the bottom-left corner of each chart:
- Uncal.: ECE = 12.67
- Temp. Scale: ECE = 0.96
- Hist. Bin.: ECE = 2.46
- Iso. Reg.: ECE = 4.16
---
### Detailed Analysis
1. **Uncal. (Uncalibrated)**:
- Highest ECE (12.67), indicating severe miscalibration.
- Blue bars (Outputs) show accuracy increasing with confidence but lagging behind confidence values.
- Pink "Gap" bars are consistently large, especially at higher confidence levels (e.g., 0.8–1.0).
2. **Temp. Scale (Temperature Scaling)**:
- Lowest ECE (0.96), suggesting optimal calibration.
- Blue bars closely align with confidence values across all levels.
- Pink "Gap" bars are minimal, indicating near-perfect alignment between confidence and accuracy.
3. **Hist. Bin. (Histogram Binning)**:
- Moderate ECE (2.46).
- Blue bars show gradual improvement in accuracy with confidence but with noticeable gaps at mid-to-high confidence levels (e.g., 0.6–0.8).
- Pink "Gap" bars are smaller than Uncal. but larger than Temp. Scale.
4. **Iso. Reg. (Isotonic Regression)**:
- ECE = 4.16, worse than Hist. Bin. but better than Uncal.
- Blue bars exhibit a steeper increase in accuracy at higher confidence levels (e.g., 0.6–1.0).
- Pink "Gap" bars are moderate, with larger discrepancies at lower confidence levels (e.g., 0.0–0.4).
---
### Key Observations
- **Calibration Trends**:
- Uncal. exhibits the largest calibration error (ECE = 12.67), with accuracy consistently below confidence.
- Temp. Scale achieves near-perfect calibration (ECE = 0.96), with minimal gaps between confidence and accuracy.
- Hist. Bin. and Iso. Reg. show intermediate performance, with Hist. Bin. slightly outperforming Iso. Reg.
- **Gap Bar Patterns**:
- The "Gap" bars visually confirm that uncalibrated models overestimate confidence, while calibrated methods reduce this discrepancy.
- Temp. Scale’s near-zero gap suggests it effectively aligns confidence with true accuracy.
---
### Interpretation
- **Calibration Effectiveness**:
- Temperature scaling (Temp. Scale) is the most effective method, reducing ECE to near-zero levels. This implies the model’s confidence closely matches its true performance.
- Uncalibrated models (Uncal.) are highly overconfident, as evidenced by the large ECE and persistent gaps between confidence and accuracy.
- **Method Trade-offs**:
- Histogram binning (Hist. Bin.) and isotonic regression (Iso. Reg.) offer partial calibration improvements but fall short of Temp. Scale. Hist. Bin. may struggle with sparse confidence bins, while Iso. Reg. introduces over-correction at lower confidence levels.
- **Practical Implications**:
- For high-stakes applications (e.g., medical diagnosis), Temp. Scale is recommended to minimize calibration error.
- Uncalibrated models should be avoided in scenarios requiring reliable confidence estimates.
---
### Spatial Grounding & Validation
- **Legend Placement**: Right-aligned in all charts, ensuring clear association with bar colors.
- **ECE Positioning**: Bottom-left corner of each chart, avoiding overlap with data bars.
- **Trend Verification**:
- Uncal.: Blue bars slope upward but remain below confidence thresholds (validated by large pink gaps).
- Temp. Scale: Blue bars nearly overlap with confidence increments (validated by minimal pink gaps).
- Hist. Bin.: Blue bars show stepwise increases, with gaps concentrated at mid-confidence levels.
- Iso. Reg.: Blue bars rise sharply at higher confidence, with gaps decreasing toward 1.0.
---
### Conclusion
The charts demonstrate that temperature scaling (Temp. Scale) is the most effective calibration method for ResNet-110 (SD) on CIFAR-100, achieving near-perfect alignment between confidence and accuracy. Uncalibrated models exhibit severe overconfidence, while histogram binning and isotonic regression offer partial improvements. These results underscore the importance of calibration in deploying reliable machine learning models.