# Technical Document Analysis: Probability of False Alarm Over Time
## Chart Description
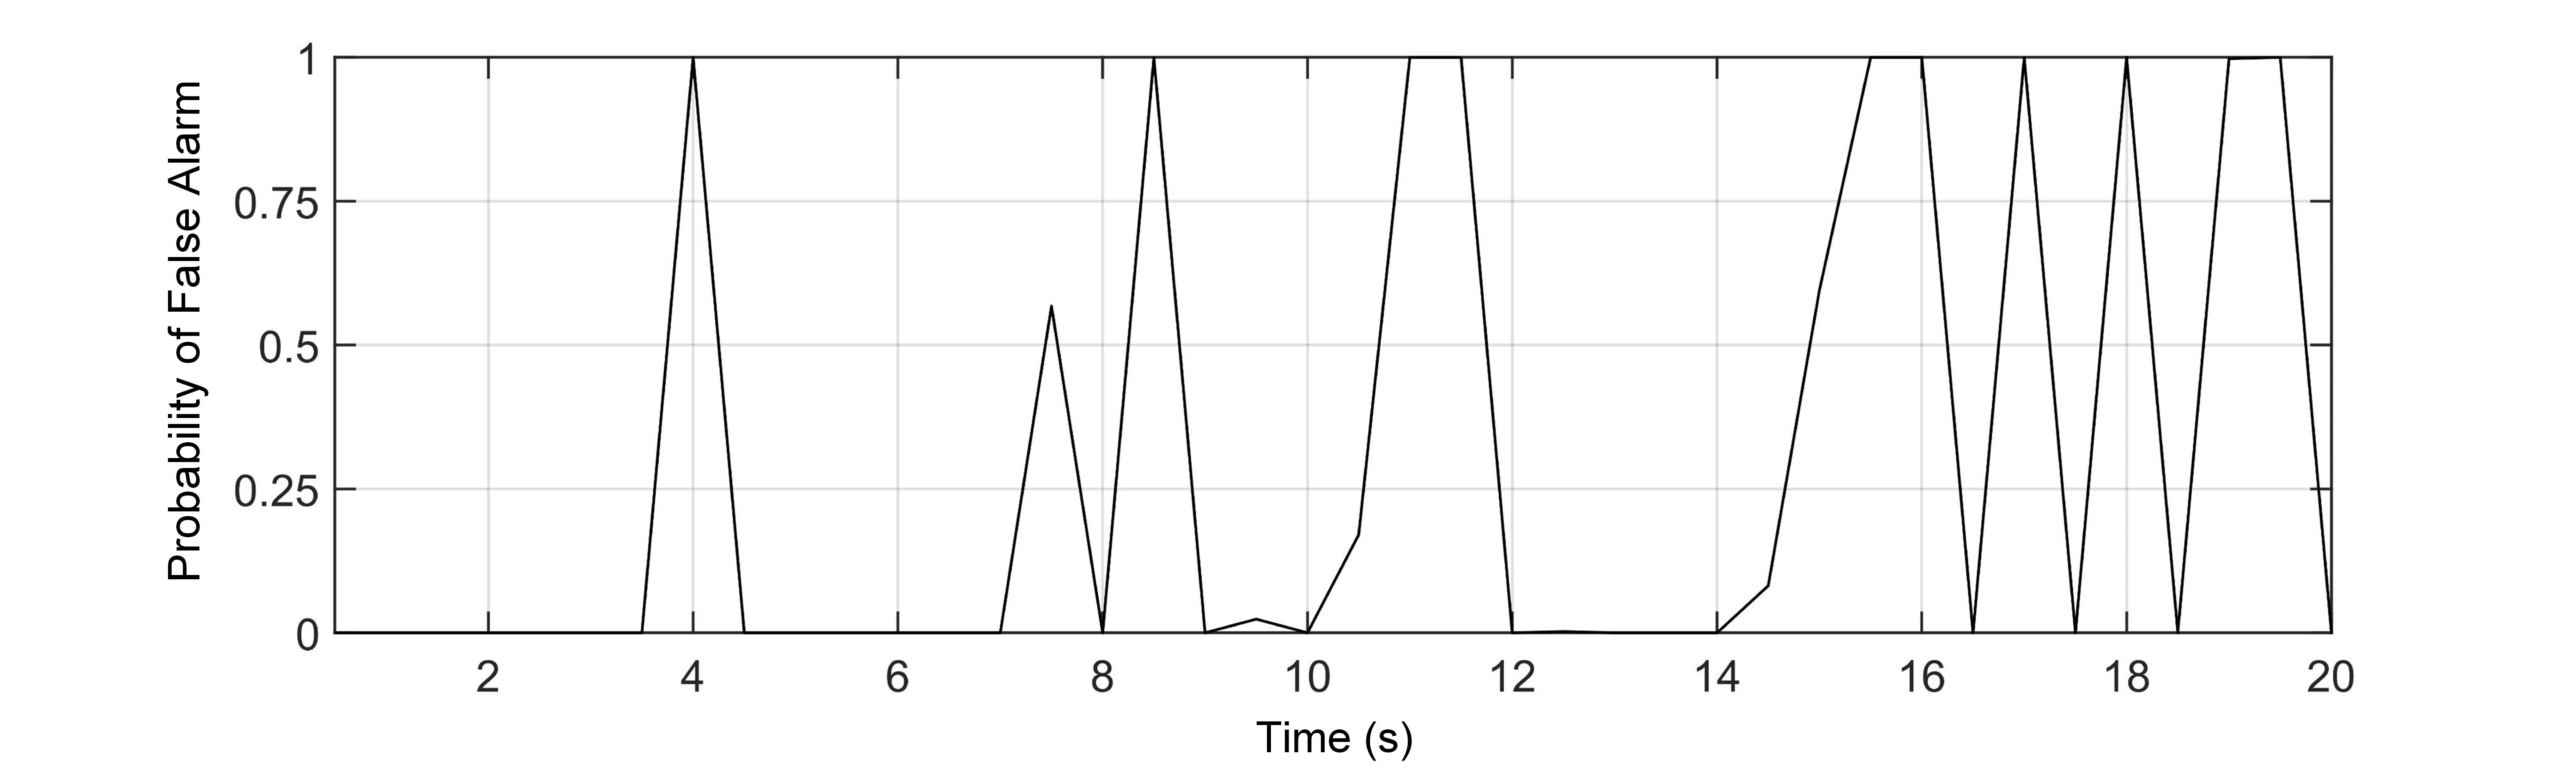
The image depicts a **line graph** illustrating the **Probability of False Alarm** as a function of **Time (s)**. The graph is plotted on a Cartesian coordinate system with a grid overlay for reference.
---
### **Axis Labels and Markers**
- **X-Axis (Horizontal):**
- Title: `Time (s)`
- Range: `0` to `20` seconds
- Increment: `2` seconds (labeled at 0, 2, 4, ..., 20)
- **Y-Axis (Vertical):**
- Title: `Probability of False Alarm`
- Range: `0` to `1`
- Increment: `0.25` (labeled at 0, 0.25, 0.5, 0.75, 1)
---
### **Key Trends and Data Points**
1. **Line Behavior:**
- The line exhibits **periodic sharp peaks** at specific time intervals.
- Peaks occur at:
- `4s` → Probability = `1`
- `8s` → Probability = `1`
- `12s` → Probability = `1`
- `16s` → Probability = `1`
- `20s` → Probability = `1`
- Between peaks, the probability drops abruptly to `0`.
- The pattern repeats every `4 seconds` (e.g., 4s → 8s → 12s → ...).
2. **Visual Characteristics:**
- Peaks are **triangular spikes** with vertical ascents/descents.
- No intermediate values between peaks (line is discontinuous at `0` between spikes).
---
### **Legend and Additional Components**
- **Legend:**
- **Absent** (no legend present in the image).
- **Grid:**
- Light gray grid lines align with axis markers for reference.
---
### **Critical Observations**
1. **Periodicity:**
- The false alarm probability follows a **4-second cycle**, with maximum probability (`1`) at multiples of `4s`.
2. **Deterministic Behavior:**
- The line does not exhibit randomness; peaks are strictly periodic and deterministic.
3. **No Intermediate Values:**
- The probability is either `0` or `1` at all measured times.
---
### **Conclusion**
The graph represents a **binary, periodic system** where false alarms occur with certainty every `4 seconds`. No other data series or variables are depicted.