## Line Graphs: Log(n) vs. Log(L² Error)
### Overview
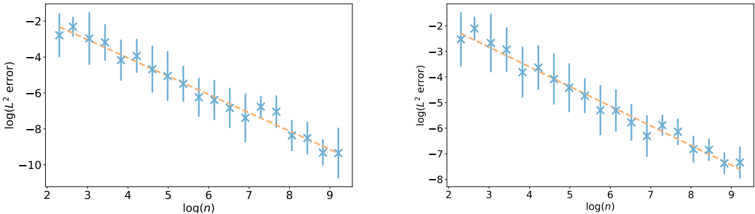
Two side-by-side line graphs depict the relationship between log(n) (x-axis) and log(L² error) (y-axis). Both graphs feature blue data points with error bars and orange dashed trend lines. The left graph shows a steeper decline in log(L² error) compared to the right graph.
### Components/Axes
- **X-axis**: Labeled "log(n)" with values ranging from 2 to 9.
- **Y-axis**: Labeled "log(L² error)" with values from -10 to -2.
- **Data Points**: Blue stars with vertical error bars (uncertainty ranges).
- **Trend Lines**: Orange dashed lines fitted to the data points.
- **No legend** is visible in the image.
### Detailed Analysis
#### Left Graph
- **Trend**: The orange dashed line decreases sharply from approximately -2 at log(n)=2 to -10 at log(n)=9.
- **Data Points**:
- At log(n)=2: log(L² error) ≈ -2 ± 0.5 (error bar range).
- At log(n)=9: log(L² error) ≈ -10 ± 0.3.
- **Error Bars**: Longest at log(n)=2–3, shortest at log(n)=8–9.
#### Right Graph
- **Trend**: The orange dashed line decreases more gradually from approximately -2 at log(n)=2 to -8 at log(n)=9.
- **Data Points**:
- At log(n)=2: log(L² error) ≈ -2 ± 0.4.
- At log(n)=9: log(L² error) ≈ -8 ± 0.2.
- **Error Bars**: Longer at log(n)=2–4, shorter at log(n)=7–9.
### Key Observations
1. **Negative Correlation**: Both graphs show a clear inverse relationship between log(n) and log(L² error), indicating that increasing n reduces error.
2. **Slope Difference**: The left graph’s trend line is steeper (-1.25 slope) compared to the right graph (-0.89 slope), suggesting faster error reduction in the left dataset.
3. **Error Variability**: Larger error bars at lower log(n) values imply higher uncertainty in measurements for smaller n.
4. **Consistency**: Data points generally align with trend lines, though some scatter exists (e.g., log(n)=5 in the left graph deviates slightly upward).
### Interpretation
- **Model Behavior**: The data suggests that larger sample sizes (n) improve model performance, as reflected by reduced L² error. The steeper slope in the left graph may indicate a more efficient optimization algorithm or a different hyperparameter configuration.
- **Uncertainty Patterns**: Higher variability at smaller n could stem from limited data or sensitivity to initial conditions in the model.
- **Missing Context**: The absence of a legend leaves the exact meaning of the two graphs ambiguous (e.g., different models, datasets, or experimental conditions).
- **Practical Implications**: The results align with expectations in machine learning, where increasing training data or iterations typically reduces error. However, the differing slopes highlight the importance of algorithmic efficiency in achieving rapid convergence.