## Line Graph: Training Metrics Over Steps
### Overview
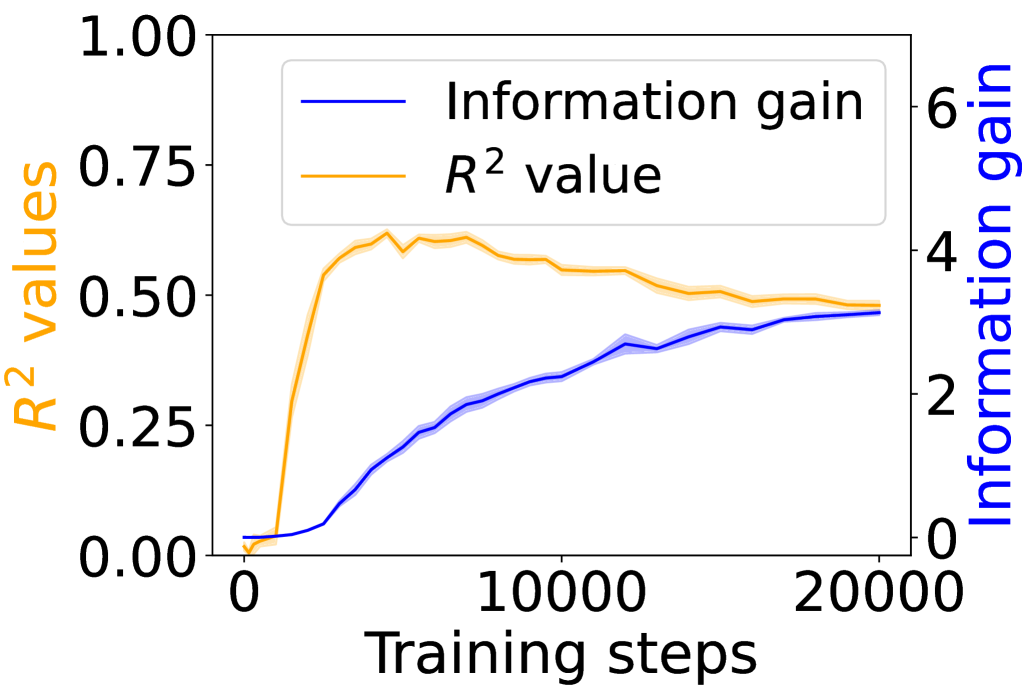
The image depicts a line graph comparing two metrics—**Information gain** and **R² values**—across **20,000 training steps**. The graph uses dual y-axes: the left axis measures **R² values** (0–1), and the right axis measures **Information gain** (0–6). Both metrics show distinct trends over training steps.
---
### Components/Axes
- **X-axis**: Training steps (0 to 20,000, linear scale).
- **Left Y-axis**: R² values (0 to 1.00, increments of 0.25).
- **Right Y-axis**: Information gain (0 to 6, increments of 2).
- **Legend**: Located in the top-left corner, with:
- **Blue line**: Information gain.
- **Orange line**: R² value.
---
### Detailed Analysis
1. **Information gain (Blue line)**:
- Starts at **0** at step 0.
- Increases steadily, reaching **~4.5** by 20,000 steps.
- Slope is consistent, with minor fluctuations (e.g., slight dips around 10,000 steps).
2. **R² value (Orange line)**:
- Begins at **0** at step 0.
- Rises sharply to **~0.75** by ~5,000 steps.
- Plateaus around **~0.5** after 10,000 steps, with minor oscillations.
---
### Key Observations
- **Information gain** increases linearly throughout training, suggesting continuous improvement in model utility.
- **R² value** peaks early (~5,000 steps) and then declines, indicating diminishing returns in predictive accuracy.
- The dual axes highlight a disconnect: while Information gain grows, R² stabilizes, implying the model may prioritize exploration over exploitation.
---
### Interpretation
The data suggests that as training progresses:
1. **Information gain** reflects the model’s ability to reduce uncertainty in predictions, improving steadily.
2. **R² value** measures how well the model explains variance in the data, peaking early and then plateauing. This could indicate overfitting or saturation of simple patterns.
3. The divergence between the two metrics implies a trade-off: the model may be learning complex, less generalizable features (high Information gain) rather than refining core predictive relationships (R²).
This pattern is common in reinforcement learning, where exploration (driving Information gain) often outpaces immediate performance gains (R²). Further analysis could investigate whether the model’s behavior aligns with expected convergence properties.