\n
## Line Chart: Training Performance Metrics
### Overview
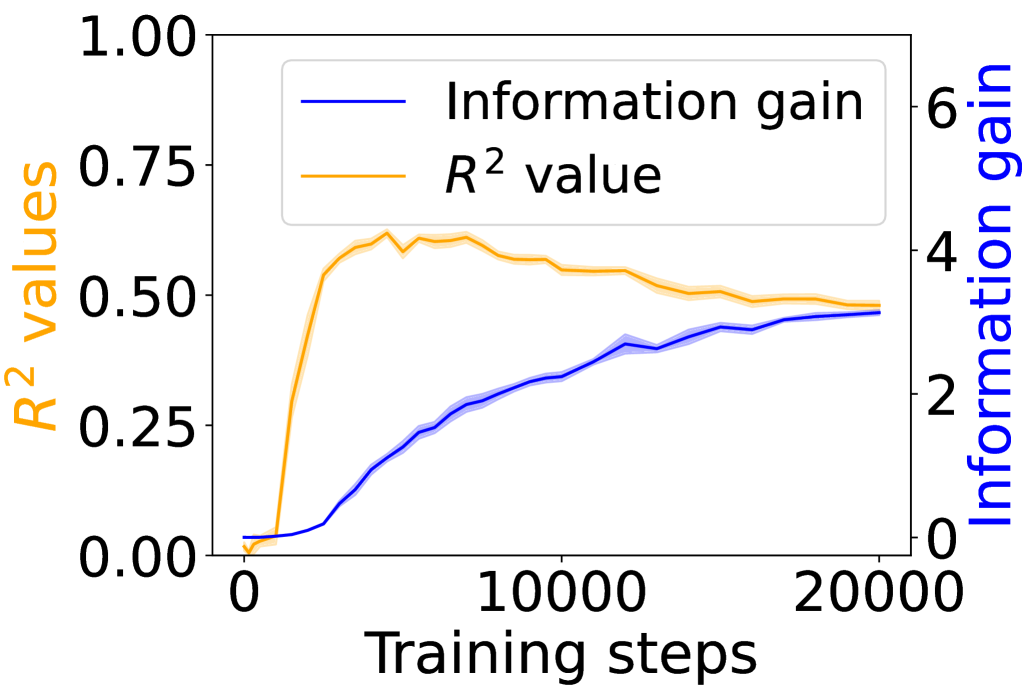
This image presents a line chart illustrating the progression of two key metrics – Information Gain and R² value – during a training process, plotted against the number of training steps. The chart displays how these metrics change as the training progresses from 0 to approximately 20,000 steps. The Information Gain is plotted on the right y-axis, while the R² value is plotted on the left y-axis.
### Components/Axes
* **X-axis:** "Training steps" ranging from 0 to 20000.
* **Left Y-axis:** "R² values" ranging from 0.00 to 1.00.
* **Right Y-axis:** "Information gain" ranging from 0 to 6.
* **Legend:** Located in the top-left corner, containing two entries:
* "Information gain" – represented by a blue line.
* "R² value" – represented by an orange line.
### Detailed Analysis
* **R² Value (Orange Line):** The orange line representing the R² value starts at approximately 0.00 at 0 training steps. It rapidly increases to a peak of approximately 0.65 at around 2000 training steps. After the peak, it gradually declines, stabilizing around 0.52 by 20000 training steps. The trend is initially steeply upward, then flattens and slightly decreases.
* **Information Gain (Blue Line):** The blue line representing Information Gain starts at approximately 0.00 at 0 training steps. It exhibits a steady, but slower, increase compared to the R² value. By 20000 training steps, the Information Gain reaches approximately 0.40. The trend is consistently upward, but with diminishing returns as the number of training steps increases.
### Key Observations
* The R² value peaks early in the training process and then plateaus, suggesting diminishing returns from further training in terms of model fit.
* Information Gain continues to increase throughout the entire training process, albeit at a decreasing rate.
* The R² value is consistently higher than the Information Gain throughout the training process.
* There is no clear point of convergence between the two metrics.
### Interpretation
The chart suggests that the model initially benefits significantly from training, as indicated by the rapid increase in the R² value. However, after a certain point (around 2000 training steps), further training provides diminishing returns in terms of improving the model's fit to the data (as measured by R²). The continuous increase in Information Gain suggests that the model is still learning and gaining new information, even as its ability to fit the training data plateaus. This could indicate that the model is becoming more complex and potentially overfitting to the training data, or that the remaining information gain is related to aspects of the data that are not directly captured by the R² value. The divergence between the two metrics suggests that optimizing for R² alone may not be sufficient to achieve optimal performance, and that considering Information Gain could provide a more comprehensive understanding of the training process. The plateau in R² could also indicate the need for regularization techniques to prevent overfitting.