## Scatter Plot: Moral Disputes
### Overview
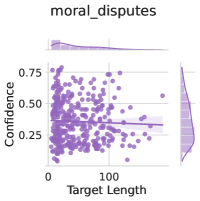
The image is a scatter plot titled "moral_disputes". It displays the relationship between "Target Length" on the x-axis and "Confidence" on the y-axis. The plot includes a regression line with a confidence interval shaded around it. Density plots are shown along the top and right edges of the scatter plot, representing the distributions of "Target Length" and "Confidence" respectively.
### Components/Axes
* **Title:** moral\_disputes
* **X-axis:** Target Length
* Scale: 0 to 100
* **Y-axis:** Confidence
* Scale: 0.25 to 0.75
* **Data Points:** Purple dots representing individual data points.
* **Regression Line:** A dark purple line showing the linear regression fit to the data.
* **Confidence Interval:** A shaded purple area around the regression line, indicating the uncertainty in the regression estimate.
* **Marginal Density Plots:**
* Top: Density plot of Target Length.
* Right: Density plot of Confidence.
### Detailed Analysis
* **Data Point Distribution:** The data points are concentrated at lower target lengths (0-50) and spread out more sparsely as target length increases.
* **Regression Line:** The regression line has a slight negative slope, suggesting a weak negative correlation between target length and confidence.
* **Confidence Interval:** The confidence interval widens slightly as target length increases, indicating greater uncertainty in the regression estimate for longer target lengths.
* **Marginal Density Plots:**
* Target Length: The density plot shows a right-skewed distribution, with most target lengths concentrated at lower values.
* Confidence: The density plot shows a distribution centered around 0.4, with a slight skew towards higher confidence values.
### Key Observations
* The majority of data points are clustered at lower target lengths.
* There is a weak negative correlation between target length and confidence.
* The confidence interval widens as target length increases.
### Interpretation
The scatter plot suggests that for "moral_disputes", there is a slight tendency for confidence to decrease as the target length increases. However, the correlation is weak, and the wide confidence interval indicates considerable uncertainty. The concentration of data points at lower target lengths suggests that shorter targets are more common in the dataset. The marginal density plots provide additional information about the distributions of target length and confidence, confirming the right-skewed distribution of target length and the relatively centered distribution of confidence.