## Scatter Plot with Marginal Distributions: moral_disputes
### Overview
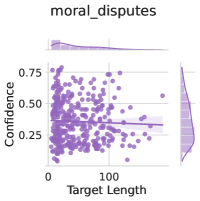
The image is a statistical visualization, specifically a scatter plot with marginal distribution plots (histograms or density plots) on the top and right sides. The chart is titled "moral_disputes" and explores the relationship between two variables: "Target Length" and "Confidence." The data points are represented as purple circles, and a horizontal reference line is drawn across the main plot area.
### Components/Axes
* **Chart Title:** `moral_disputes` (centered at the top).
* **Main Plot (Scatter Plot):**
* **X-Axis Label:** `Target Length`
* **X-Axis Scale:** Linear scale. Visible major tick marks and labels at `0` and `100`. The axis extends to approximately 200 based on the data spread.
* **Y-Axis Label:** `Confidence`
* **Y-Axis Scale:** Linear scale. Visible major tick marks and labels at `0.00`, `0.25`, `0.50`, and `0.75`.
* **Data Series:** A single series of data points, all colored a medium purple (approximately hex #9467bd). There is no explicit legend, as only one data series is present.
* **Reference Line:** A solid, thin, horizontal line in a darker shade of purple or gray, positioned at approximately `y = 0.35`.
* **Marginal Plots:**
* **Top Marginal Plot:** A distribution plot (likely a histogram or kernel density estimate) aligned with the X-axis ("Target Length"). It shows the frequency/density distribution of the "Target Length" variable.
* **Right Marginal Plot:** A distribution plot aligned with the Y-axis ("Confidence"). It shows the frequency/density distribution of the "Confidence" variable. Both marginal plots are filled with a lighter shade of the same purple used for the scatter points.
### Detailed Analysis
* **Data Point Distribution:** The scatter plot contains approximately 150-200 data points. The points are densely clustered in the lower-left to middle region of the plot.
* **X-Axis (Target Length) Range:** Data points span from near `0` to approximately `180`. The highest density appears between `20` and `120`.
* **Y-Axis (Confidence) Range:** Data points span from near `0.00` to approximately `0.80`. The highest density appears between `0.20` and `0.60`.
* **Trend Verification:** There is no strong, clear linear correlation (upward or downward slope) visible between "Target Length" and "Confidence." The cloud of points is somewhat amorphous, though a very weak positive trend might be inferred, as points with higher "Target Length" (>100) are less common at the very lowest "Confidence" values (<0.10).
* **Reference Line:** The horizontal line at `y ≈ 0.35` cuts through the central mass of the data cloud. It likely represents a measure of central tendency for the "Confidence" variable, such as the mean or median.
* **Marginal Distributions:**
* **Top (Target Length):** The distribution is right-skewed. It peaks sharply between `Target Length` values of approximately `40-80` and has a long tail extending towards higher values (up to ~180).
* **Right (Confidence):** The distribution appears roughly unimodal and slightly left-skewed. It peaks around a `Confidence` value of `0.3-0.4`, aligning with the horizontal reference line in the main plot.
### Key Observations
1. **Cluster Density:** The highest concentration of data points occurs for `Target Length` between 20-120 and `Confidence` between 0.20-0.60.
2. **Absence of Strong Correlation:** The primary observation is the lack of a definitive relationship between the two variables. Knowing the "Target Length" does not allow for a precise prediction of "Confidence," and vice-versa.
3. **Central Tendency:** The horizontal reference line at `~0.35` and the peak of the right marginal plot both suggest that the typical or average "Confidence" level in this dataset is moderately low, around 35%.
4. **Outliers:** A few data points exist with relatively high "Confidence" (>0.70) across various "Target Lengths." Similarly, a few points have very low "Confidence" (<0.10). There are no extreme outliers in "Target Length" beyond ~180.
### Interpretation
This visualization suggests that within the context of "moral_disputes," the length of a target (perhaps a text, argument, or case description) is not a strong predictor of the confidence level associated with it. The data does not support a hypothesis that longer targets systematically lead to higher or lower confidence.
The key finding is the central clustering around a modest confidence level of approximately 35%. This could indicate that, on average, judgments or measurements related to these moral disputes are made with relatively low certainty. The right-skewed distribution of "Target Length" implies that most disputes involve shorter targets, with fewer cases involving very long or complex targets.
The chart effectively uses marginal distributions to provide crucial context that the scatter plot alone would miss: it reveals the underlying shape of each variable's distribution, highlighting the common ranges and the skew in "Target Length." The absence of a clear pattern in the scatter plot is itself a significant piece of information, directing inquiry away from a simple linear relationship between these two specific metrics.