## Scatter Plot: moral_disputes
### Overview
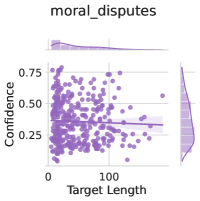
The image is a scatter plot titled "moral_disputes" with a line of best fit. It visualizes the relationship between "Target Length" (x-axis) and "Confidence" (y-axis). Data points are represented as purple dots, and a dark blue line indicates the trend. Marginal distributions are shown in the top and right subplots.
### Components/Axes
- **Title**: "moral_disputes" (top center).
- **X-axis**: "Target Length" (0 to 100, linear scale).
- **Y-axis**: "Confidence" (0.25 to 0.75, linear scale).
- **Legend**: "Line of Best Fit" (dark blue) located at the top-right corner.
- **Marginal Plots**:
- Top subplot: Distribution of "Target Length" (purple histogram).
- Right subplot: Distribution of "Confidence" (purple histogram).
### Detailed Analysis
- **Data Points**:
- Approximately 100 purple dots scattered across the plot.
- Confidence values range from ~0.25 to ~0.75, with most points clustered between 0.3 and 0.5.
- Target Length values range from 0 to 100, with a concentration between 0 and 50.
- **Line of Best Fit**:
- Dark blue line slopes slightly upward from left to right.
- Starts near (0, 0.35) and ends near (100, 0.45).
- Confidence increases by ~0.1 over the full range of Target Length.
- **Marginal Distributions**:
- Top histogram: Target Length peaks between 0–20 and 40–60, with a long tail toward 100.
- Right histogram: Confidence peaks near 0.3–0.4, with a secondary peak near 0.6–0.7.
### Key Observations
1. **Weak Positive Correlation**: The upward trend suggests a slight increase in confidence with longer target lengths, but the spread indicates variability.
2. **Outliers**: A few points exceed 0.75 confidence, particularly at higher Target Length values.
3. **Distribution Skew**: Confidence is more concentrated in the lower range (0.3–0.5), while Target Length has a bimodal distribution.
### Interpretation
The plot suggests a weak positive relationship between Target Length and Confidence in moral disputes, though the relationship is not strong. Most data points cluster around moderate confidence levels (0.3–0.5), indicating that longer target lengths do not consistently lead to higher confidence. The marginal distributions reveal that shorter Target Lengths (0–50) dominate, while higher confidence values (>0.6) are rare and associated with longer lengths. This could imply that confidence in moral disputes is influenced by factors beyond Target Length, such as context or individual variability. The line of best fit’s shallow slope reinforces the limited predictive power of Target Length alone.