## Line Chart: Induction Success vs. Parameters
### Overview
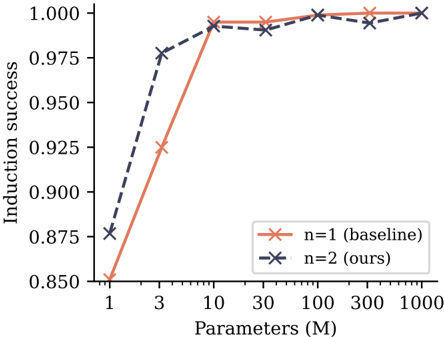
The image is a line chart comparing the induction success of two models (n=1 baseline and n=2 ours) across varying parameter sizes (in millions). The x-axis represents the number of parameters, and the y-axis represents the induction success rate.
### Components/Axes
* **X-axis:** Parameters (M). Logarithmic scale with markers at 1, 3, 10, 30, 100, 300, and 1000.
* **Y-axis:** Induction success. Linear scale with markers at 0.850, 0.875, 0.900, 0.925, 0.950, 0.975, and 1.000.
* **Legend:** Located in the bottom-right corner.
* **Orange Line:** n=1 (baseline)
* **Dark Blue Dashed Line:** n=2 (ours)
### Detailed Analysis
* **n=1 (baseline) - Orange Line:**
* Trend: The line starts at approximately 0.85 for 1M parameters, rises sharply to approximately 0.99 for 10M parameters, and then plateaus around 0.99-1.00 for higher parameter values.
* Data Points:
* 1M Parameters: ~0.85
* 3M Parameters: ~0.925
* 10M Parameters: ~0.99
* 30M Parameters: ~0.99
* 100M Parameters: ~1.00
* 300M Parameters: ~0.99
* 1000M Parameters: ~1.00
* **n=2 (ours) - Dark Blue Dashed Line:**
* Trend: The line starts at approximately 0.875 for 1M parameters, rises to approximately 0.975 for 3M parameters, and then plateaus around 0.99-1.00 for higher parameter values.
* Data Points:
* 1M Parameters: ~0.875
* 3M Parameters: ~0.975
* 10M Parameters: ~0.99
* 30M Parameters: ~0.99
* 100M Parameters: ~1.00
* 300M Parameters: ~0.99
* 1000M Parameters: ~1.00
### Key Observations
* For lower parameter values (1M to 10M), the n=2 model (ours) shows a higher induction success rate compared to the n=1 (baseline) model.
* As the number of parameters increases beyond 10M, both models converge to a similar induction success rate, plateauing around 0.99-1.00.
* The n=1 model experiences a more significant jump in induction success between 1M and 10M parameters compared to the n=2 model.
### Interpretation
The chart suggests that the "n=2 (ours)" model achieves better induction success with fewer parameters compared to the "n=1 (baseline)" model, especially in the range of 1M to 10M parameters. This indicates that the "n=2" model is more efficient in utilizing parameters to achieve a higher success rate. However, beyond 10M parameters, the performance of both models becomes comparable, suggesting a saturation point where increasing parameters does not significantly improve induction success. The "n=1" model requires more parameters to reach a similar level of induction success as the "n=2" model.