## Line Chart: Induction Success vs. Model Parameters
### Overview
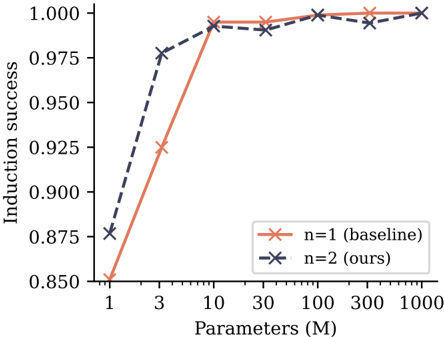
This is a line chart comparing the "Induction success" of two models, labeled "n=1 (baseline)" and "n=2 (ours)", as a function of model size measured in millions of parameters. The chart demonstrates how performance scales with increased model capacity.
### Components/Axes
* **Chart Type:** Line chart with markers.
* **X-Axis (Horizontal):**
* **Label:** "Parameters (M)"
* **Scale:** Logarithmic scale.
* **Tick Values:** 1, 3, 10, 30, 100, 300, 1000.
* **Y-Axis (Vertical):**
* **Label:** "Induction success"
* **Scale:** Linear scale.
* **Range:** 0.850 to 1.000.
* **Tick Values:** 0.850, 0.875, 0.900, 0.925, 0.950, 0.975, 1.000.
* **Legend:**
* **Position:** Bottom-right corner of the plot area.
* **Series 1:** "n=1 (baseline)" - Represented by an orange line with 'x' markers.
* **Series 2:** "n=2 (ours)" - Represented by a dark blue/gray dashed line with 'x' markers.
### Detailed Analysis
**Data Series 1: n=1 (baseline) - Orange Line**
* **Trend:** Shows a steep, monotonic increase in induction success as parameters increase, plateauing near the maximum value.
* **Data Points (Approximate):**
* At 1M Parameters: ~0.850
* At 3M Parameters: ~0.925
* At 10M Parameters: ~0.995
* At 30M Parameters: ~0.995
* At 100M Parameters: ~1.000
* At 300M Parameters: ~1.000
* At 1000M Parameters: ~1.000
**Data Series 2: n=2 (ours) - Dark Blue Dashed Line**
* **Trend:** Starts at a higher success rate than the baseline for small models, increases sharply, and then fluctuates slightly below the maximum value for larger models.
* **Data Points (Approximate):**
* At 1M Parameters: ~0.875
* At 3M Parameters: ~0.975
* At 10M Parameters: ~0.990
* At 30M Parameters: ~0.990
* At 100M Parameters: ~1.000
* At 300M Parameters: ~0.995
* At 1000M Parameters: ~1.000
### Key Observations
1. **Performance Crossover:** The "n=2 (ours)" model has a clear advantage at the smallest model size (1M parameters). The "n=1 (baseline)" model catches up and matches or slightly exceeds the "n=2" model's performance at 10M parameters and beyond.
2. **Diminishing Returns:** Both models show a sharp performance gain between 1M and 10M parameters. After 10M parameters, gains are minimal, with both models achieving near-perfect induction success (~1.000).
3. **Stability:** The baseline model's performance appears more stable (smoother line) at high parameter counts, while the "n=2" model shows minor fluctuations (e.g., a slight dip at 300M parameters).
### Interpretation
The chart illustrates a classic scaling law relationship between model size and task performance. The key insight is the comparison between the two approaches ("n=1" vs. "n=2").
* The "n=2 (ours)" method appears to be more **data or parameter-efficient** at the very low end of the scale, achieving higher success with fewer parameters. This suggests its architecture or training method extracts more useful signal from a small model capacity.
* However, this advantage **disappears as model size grows**. Once the model has sufficient capacity (≥10M parameters), the simpler baseline ("n=1") achieves equivalent, near-perfect performance. The minor fluctuations in the "n=2" line at high parameter counts could indicate slight instability or sensitivity in that method when scaled, though the effect is very small.
* The primary takeaway is that while the proposed "n=2" method offers benefits for extremely small models, both methods converge to the same high-performance ceiling given enough parameters. The choice between them for practical applications would depend on the target model size and the value placed on performance at the smallest scales.