## Line Graph: Induction Success vs. Parameters (M)
### Overview
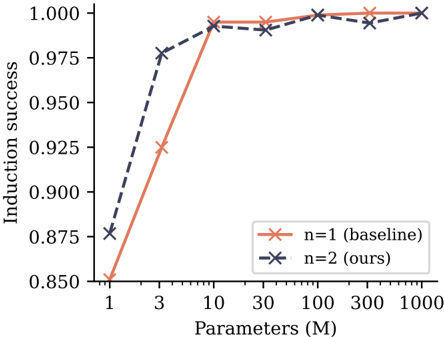
The image is a line graph comparing induction success rates across different parameter scales (M) for two models: a baseline model (n=1) and an optimized model (n=2). The graph shows how induction success improves as parameters increase, with distinct trends for each model.
### Components/Axes
- **X-axis**: "Parameters (M)" ranging from 1 to 1000 (logarithmic scale implied by spacing).
- **Y-axis**: "Induction success" measured as a decimal from 0.850 to 1.000.
- **Legend**: Located in the bottom-right corner, with:
- Red solid line: "n=1 (baseline)"
- Blue dashed line: "n=2 (ours)"
- **Data Points**: Marked with "X" symbols on both lines.
### Detailed Analysis
#### Baseline Model (n=1, Red Line)
- **Trend**: Starts at 0.850 induction success for 1M parameters, sharply increasing to 0.925 at 3M, then plateauing near 0.999 for parameters ≥10M.
- **Key Data Points**:
- 1M: 0.850
- 3M: 0.925
- 10M: 0.990
- 30M: 0.995
- 100M: 0.998
- 300M: 0.999
- 1000M: 0.999
#### Optimized Model (n=2, Blue Line)
- **Trend**: Begins at 0.875 for 1M parameters, rises steeply to 0.975 at 3M, then plateaus near 0.999 for parameters ≥10M.
- **Key Data Points**:
- 1M: 0.875
- 3M: 0.975
- 10M: 0.990
- 30M: 0.995
- 100M: 0.998
- 300M: 0.999
- 1000M: 0.999
### Key Observations
1. **Performance Gap**: The optimized model (n=2) consistently outperforms the baseline (n=1) across all parameter scales, with a larger margin at lower parameters (e.g., 0.10 difference at 1M vs. 0.001 at 1000M).
2. **Convergence**: Both models plateau near 0.999 induction success at 1000M parameters, suggesting diminishing returns at scale.
3. **Efficiency**: The optimized model achieves higher success with fewer parameters (e.g., 0.975 at 3M vs. 0.925 for the baseline).
### Interpretation
The graph demonstrates that the optimized model (n=2) achieves superior induction success with fewer parameters compared to the baseline (n=1), particularly at smaller scales. This suggests architectural or algorithmic improvements in the optimized model that enhance efficiency. The convergence at 1000M parameters implies that both models reach near-optimal performance at scale, but the optimized model does so with significantly lower resource requirements. The sharp initial rise in the blue line highlights the critical impact of parameter scaling in early stages, while the plateau indicates saturation of performance gains.