# Technical Analysis of Performance Comparison Chart
## Chart Overview
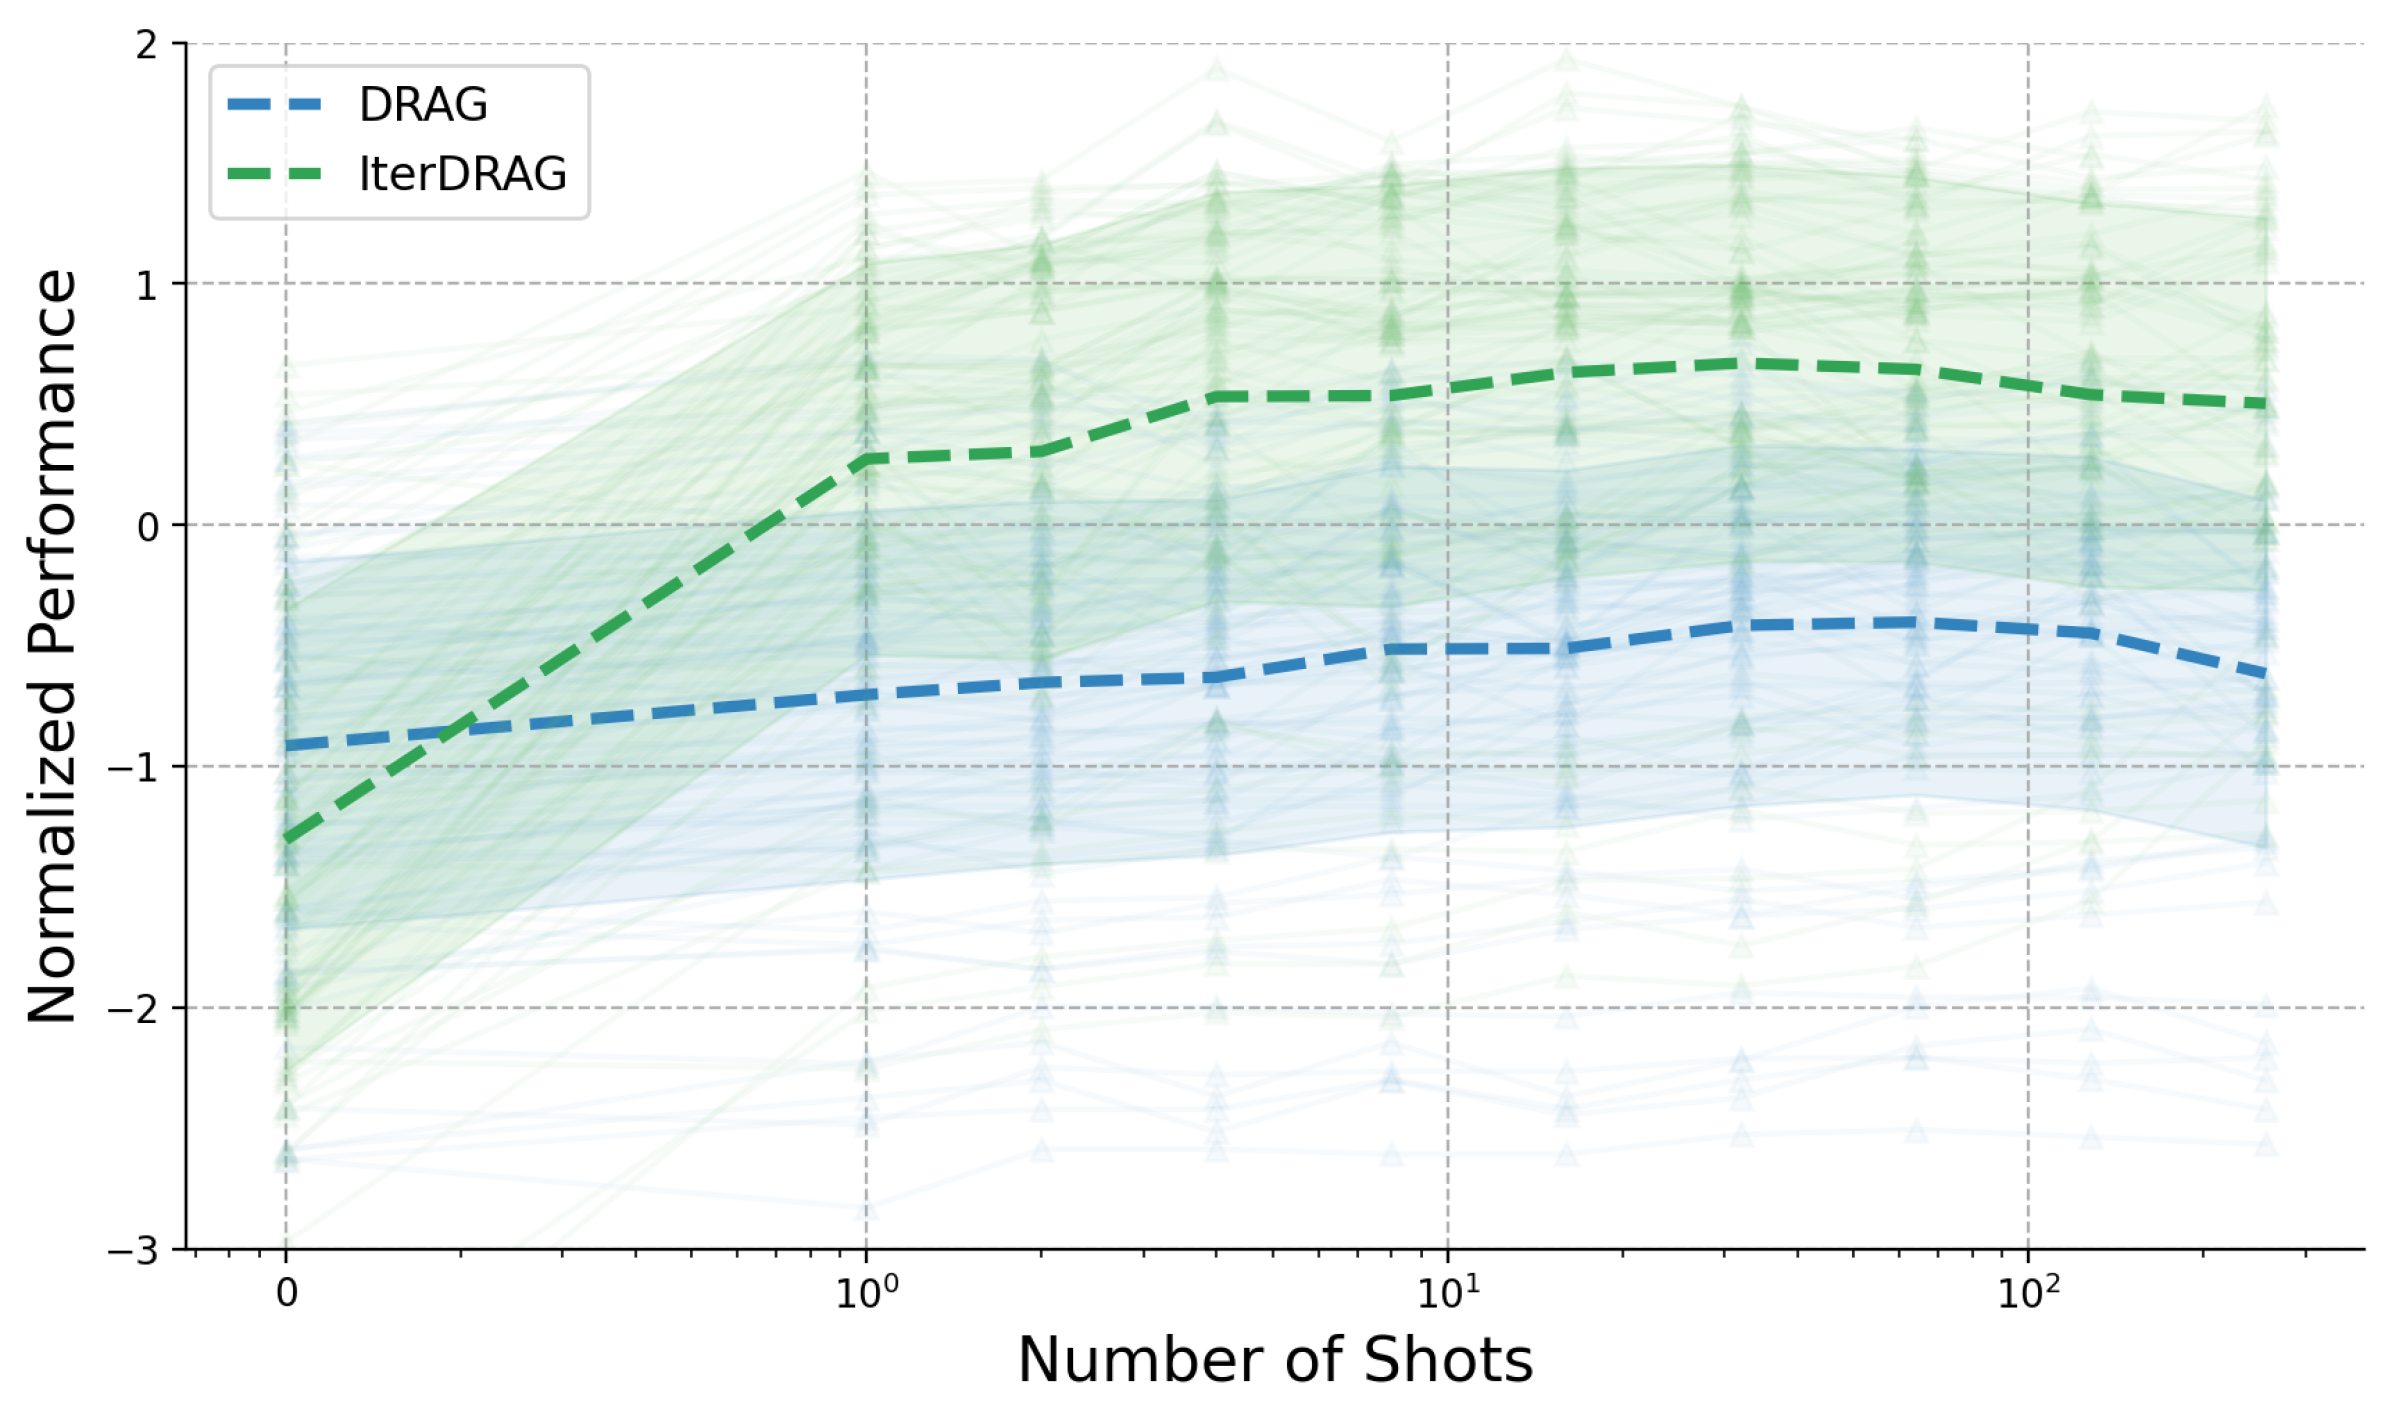
The image presents a **line chart** comparing the performance of two algorithms: **DRAG** and **IterDRAG**, across varying numbers of computational "shots". The chart uses a **logarithmic scale** for the x-axis (Number of Shots) and a **linear scale** for the y-axis (Normalized Performance).
---
### Key Components
1. **Legend**
- **Location**: Top-left corner
- **Labels**:
- `DRAG` (blue dashed line)
- `IterDRAG` (green dashed line)
2. **Axes**
- **X-axis**:
- Title: `Number of Shots`
- Scale: Logarithmic (markers at `0`, `10⁰`, `10¹`, `10²`)
- Range: `0` to `10²` (0 to 100)
- **Y-axis**:
- Title: `Normalized Performance`
- Scale: Linear (markers at `-3`, `-2`, `-1`, `0`, `1`, `2`)
- Range: `-3` to `2`
3. **Data Series**
- **DRAG** (blue dashed line):
- Starts at `~-1.5` at `0` shots.
- Gradually increases to `~-0.5` at `100` shots.
- Shaded blue region (confidence interval) narrows as shots increase.
- **IterDRAG** (green dashed line):
- Starts at `~-2.5` at `0` shots.
- Sharp upward trend, surpassing DRAG at `10¹` shots.
- Reaches `~0.5` at `100` shots.
- Shaded green region (confidence interval) remains wide, indicating higher variability.
---
### Trends and Observations
1. **DRAG Performance**
- **Trend**: Steady linear improvement with increasing shots.
- **Key Data Points**:
- `0` shots: `~-1.5`
- `10¹` shots: `~-0.7`
- `10²` shots: `~-0.5`
2. **IterDRAG Performance**
- **Trend**: Accelerated improvement, outperforming DRAG after `10¹` shots.
- **Key Data Points**:
- `0` shots: `~-2.5`
- `10¹` shots: `~0.3`
- `10²` shots: `~0.5`
3. **Variability**
- **DRAG**: Narrow shaded region (low variance).
- **IterDRAG**: Wide shaded region (high variance), especially at `0` and `10¹` shots.
---
### Spatial Grounding
- **Legend**: Top-left corner (`x=0.1, y=0.9`).
- **Line Colors**:
- Blue (`DRAG`) matches all blue dashed lines and shaded regions.
- Green (`IterDRAG`) matches all green dashed lines and shaded regions.
---
### Conclusion
The chart demonstrates that **IterDRAG** significantly outperforms **DRAG** in normalized performance as the number of shots increases, despite higher variability. DRAG shows consistent but slower improvement.