# Technical Document Extraction: F1-Score Comparison Chart
## Chart Type
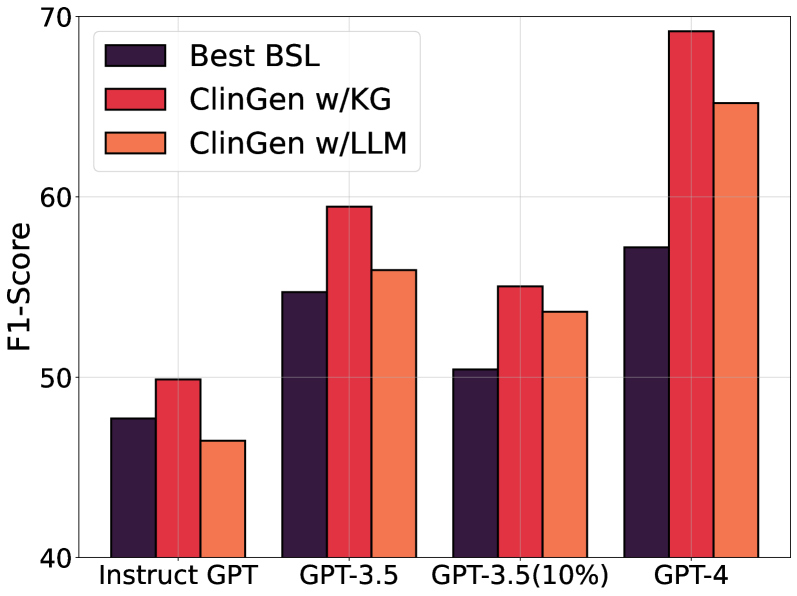
Bar chart comparing F1-Score performance across different models and GPT versions.
## Axis Labels
- **X-Axis (Categories):**
- Instruct GPT
- GPT-3.5
- GPT-3.5(10%)
- GPT-4
- **Y-Axis (Values):**
- F1-Score (ranging from 40 to 70 in increments of 10)
## Legend
- **Best BSL** (Dark Purple)
- **ClinGen w/KG** (Red)
- **ClinGen w/LLM** (Orange)
## Data Points
| GPT Version | Best BSL | ClinGen w/KG | ClinGen w/LLM |
|-------------------|----------|--------------|---------------|
| Instruct GPT | ~48 | ~50 | ~46 |
| GPT-3.5 | ~55 | ~59 | ~56 |
| GPT-3.5(10%) | ~50 | ~54 | ~53 |
| GPT-4 | ~57 | ~69 | ~66 |
## Key Trends
1. **ClinGen w/KG** consistently outperforms other models across all GPT versions, with the largest gap observed in **GPT-4** (~69 vs. ~57 for Best BSL).
2. **Best BSL** shows the lowest performance in **Instruct GPT** (~48) but improves significantly in **GPT-4** (~57).
3. **ClinGen w/LLM** demonstrates moderate performance, with scores increasing from ~46 (Instruct GPT) to ~66 (GPT-4).
4. **GPT-4** achieves the highest F1-Scores for all models, indicating improved performance with newer GPT versions.
## Visual Structure
- Grouped bars for each GPT version, with three bars per category (one per model).
- Y-axis gridlines at 10-unit intervals for readability.
- Legend positioned in the upper-left corner for clarity.