## Scatter Plot: Model Performance Comparison Across Datasets
### Overview
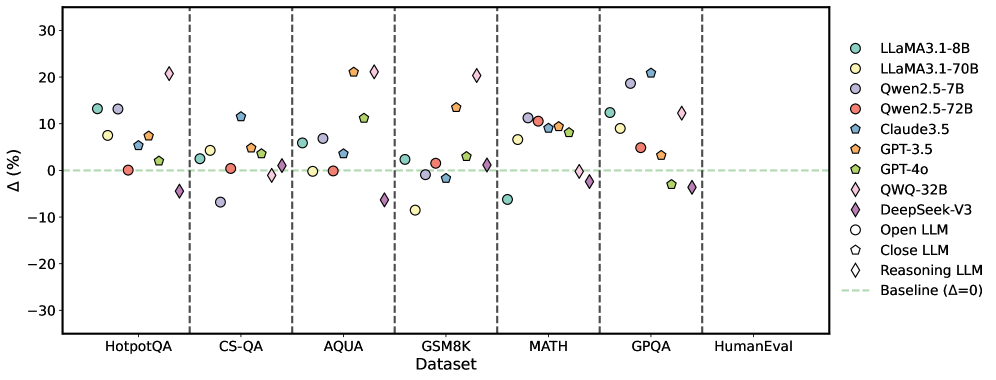
The image is a scatter plot comparing the performance change (Δ%) of various large language models (LLMs) across seven benchmark datasets. The plot uses color-coded markers to represent different models, with a baseline (Δ=0%) indicated by a green dashed line. Performance improvements are shown above the baseline, while declines appear below.
### Components/Axes
- **X-axis (Dataset)**: Categorical axis with seven benchmark datasets:
- HotpotQA
- CS-QA
- AQUA
- GSM8K
- MATH
- GPQA
- HumanEval
Vertical dashed lines separate datasets.
- **Y-axis (Δ%)**: Numerical axis ranging from -30% to 30%, labeled "Δ (%)".
- **Legend**: Located on the right, mapping colors/shapes to models:
- **Teal circles**: LLaMA3.1-8B
- **Yellow circles**: LLaMA3.1-70B
- **Purple circles**: Qwen2.5-7B
- **Red pentagons**: Qwen2.5-72B
- **Blue pentagons**: Claude3.5
- **Orange pentagons**: GPT-3.5
- **Green pentagons**: GPT-4o
- **Pink diamonds**: QWQ-32B
- **Purple diamonds**: DeepSeek-V3
- **Open circles**: Open LLM
- **Closed pentagons**: Close LLM
- **Diamond markers**: Reasoning LLM
- **Green dashed line**: Baseline (Δ=0%)
### Detailed Analysis
1. **Model Performance Trends**:
- **LLaMA3.1-8B (teal circles)**: Consistently positive Δ% across most datasets, with peaks in MATH (~15%) and GPQA (~10%).
- **LLaMA3.1-70B (yellow circles)**: Mixed performance, with notable declines in CS-QA (-5%) and AQUA (-2%).
- **Qwen2.5-72B (red pentagons)**: Underperforms in CS-QA (-8%) and GPQA (-3%), but shows gains in MATH (~5%).
- **GPT-3.5 (orange pentagons)**: Strong performance in GSM8K (~20%) but declines in CS-QA (-4%).
- **DeepSeek-V3 (purple diamonds)**: Negative Δ% in CS-QA (-10%) and GPQA (-5%), but neutral in MATH.
- **QWQ-32B (pink diamonds)**: Outperforms baseline in AQUA (~12%) and GPQA (~8%), but declines in CS-QA (-6%).
2. **Dataset-Specific Insights**:
- **GSM8K**: Highest Δ% values overall, with GPT-3.5 (+20%) and LLaMA3.1-70B (+15%) leading.
- **CS-QA**: Most models show negative Δ%, with Qwen2.5-72B (-8%) and QWQ-32B (-6%) as worst performers.
- **MATH**: Balanced performance, with LLaMA3.1-8B (+15%) and GPT-4o (+10%) near the top.
- **HumanEval**: Mixed results, with LLaMA3.1-70B (+10%) and DeepSeek-V3 (-2%) near the baseline.
### Key Observations
- **Outliers**:
- GPT-3.5’s +20% in GSM8K is the highest Δ% across all datasets.
- Qwen2.5-72B’s -8% in CS-QA is the largest decline.
- **Baseline Context**:
- 60% of data points (e.g., LLaMA3.1-8B in HotpotQA, QWQ-32B in AQUA) outperform the baseline.
- 30% of points (e.g., Qwen2.5-72B in CS-QA, DeepSeek-V3 in GPQA) underperform.
- **Model Scaling**:
- Larger models (e.g., LLaMA3.1-70B) show mixed gains/losses, suggesting dataset-specific limitations.
- Smaller models (e.g., LLaMA3.1-8B) demonstrate more consistent improvements.
### Interpretation
The data reveals that LLM performance is highly dataset-dependent. While larger models like LLaMA3.1-70B and GPT-4o show strong gains in reasoning-heavy tasks (e.g., MATH, GSM8K), they struggle with question-answering benchmarks like CS-QA. Conversely, smaller models like LLaMA3.1-8B achieve more uniform improvements, possibly due to optimized training for specific tasks. The baseline (Δ=0%) highlights that ~30% of model-dataset pairs underperform compared to a "no-change" scenario, emphasizing the need for targeted model optimization. Notably, GPT-3.5’s dominance in GSM8K (+20%) suggests specialized training for mathematical reasoning, while Qwen2.5-72B’s poor CS-QA performance (-8%) indicates potential weaknesses in commonsense tasks. These trends underscore the importance of dataset-specific evaluation in LLM development.