\n
## Bar Chart: Model Performance Comparison (ΔP)
### Overview
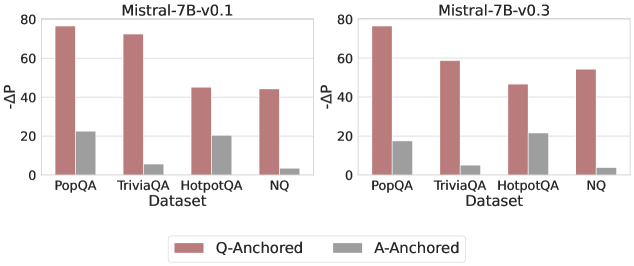
The image displays two side-by-side bar charts comparing the performance change (ΔP) of two versions of the Mistral-7B model across four question-answering datasets. The comparison is between two anchoring methods: "Q-Anchored" and "A-Anchored".
### Components/Axes
* **Chart Titles:** "Mistral-7B-v0.1" (left chart), "Mistral-7B-v0.3" (right chart).
* **Y-Axis:** Labeled "ΔP". The scale runs from 0 to 80, with major tick marks at 0, 20, 40, 60, and 80.
* **X-Axis:** Labeled "Dataset". The categories are, from left to right: "PopQA", "TriviaQA", "HotpotQA", "NQ".
* **Legend:** Located at the bottom center of the image. It defines two data series:
* **Q-Anchored:** Represented by a reddish-brown (terracotta) color.
* **A-Anchored:** Represented by a grey color.
* **Data Series:** Each dataset category has two adjacent bars, one for each anchoring method.
### Detailed Analysis
**Mistral-7B-v0.1 (Left Chart):**
* **Trend Verification:** The Q-Anchored (reddish-brown) bars are consistently and significantly taller than the A-Anchored (grey) bars for all datasets.
* **Data Points (Approximate ΔP values):**
* **PopQA:** Q-Anchored ≈ 75, A-Anchored ≈ 22.
* **TriviaQA:** Q-Anchored ≈ 72, A-Anchored ≈ 5.
* **HotpotQA:** Q-Anchored ≈ 45, A-Anchored ≈ 20.
* **NQ:** Q-Anchored ≈ 44, A-Anchored ≈ 3.
**Mistral-7B-v0.3 (Right Chart):**
* **Trend Verification:** The Q-Anchored bars remain taller than the A-Anchored bars for all datasets. Compared to v0.1, the Q-Anchored performance appears to have decreased for most datasets, while A-Anchored performance remains low and relatively stable.
* **Data Points (Approximate ΔP values):**
* **PopQA:** Q-Anchored ≈ 76, A-Anchored ≈ 17.
* **TriviaQA:** Q-Anchored ≈ 59, A-Anchored ≈ 5.
* **HotpotQA:** Q-Anchored ≈ 47, A-Anchored ≈ 21.
* **NQ:** Q-Anchored ≈ 54, A-Anchored ≈ 4.
### Key Observations
1. **Dominant Anchoring Method:** The Q-Anchored method yields a substantially higher ΔP than the A-Anchored method across all datasets and both model versions. The difference is most extreme for TriviaQA and NQ in v0.1.
2. **Version Comparison (v0.1 vs. v0.3):**
* **PopQA:** Performance is very similar between versions for both methods.
* **TriviaQA:** Shows the most significant change. The Q-Anchored ΔP drops sharply from ~72 (v0.1) to ~59 (v0.3).
* **HotpotQA & NQ:** Q-Anchored ΔP increases slightly from v0.1 to v0.3 (HotpotQA: ~45 to ~47; NQ: ~44 to ~54).
* **A-Anchored:** Shows minimal change across versions for all datasets.
3. **Dataset Sensitivity:** The impact of the model version change is not uniform; it negatively affects performance on TriviaQA while positively affecting it on NQ for the Q-Anchored method.
### Interpretation
This chart likely illustrates the effectiveness of different prompting or fine-tuning strategies ("anchoring") on a model's performance, measured by a metric ΔP (which could represent a performance gain, probability change, or similar).
* **What the data suggests:** The "Q-Anchored" strategy is overwhelmingly more effective than the "A-Anchored" strategy for the Mistral-7B model on these knowledge-intensive QA tasks. This could imply that conditioning on or emphasizing the question (Q) is more beneficial than conditioning on the answer (A) for this model and metric.
* **How elements relate:** The side-by-side comparison isolates the effect of the model version (v0.1 vs. v0.3). The varying impact across datasets suggests that the updates between model versions did not uniformly improve all capabilities. The improvement on NQ and decline on TriviaQA might indicate shifts in the model's internal knowledge base or reasoning patterns between versions.
* **Notable anomalies:** The drastic drop in Q-Anchored performance on TriviaQA for v0.3 is a key anomaly. It suggests a potential regression in the model's ability to handle that specific type of question or data distribution when using the otherwise superior anchoring method. The consistently low A-Anchored scores indicate this method provides little to no benefit over a baseline (ΔP=0) for these tasks.