## Bar Chart: Mistral-7B Model Performance Comparison (v0.1 vs v0.3)
### Overview
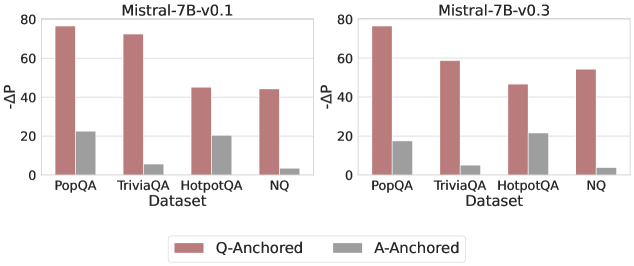
The image contains two side-by-side bar charts comparing the performance of the Mistral-7B model (versions v0.1 and v0.3) across four question-answering datasets: PopQA, TriviaQA, HotpotQA, and NQ. Performance is measured using ΔP (delta-P) values, with separate bars for Q-Anchored and A-Anchored methods. The charts highlight differences in performance between model versions and anchoring approaches.
### Components/Axes
- **X-Axis (Datasets)**: PopQA, TriviaQA, HotpotQA, NQ (categorical, left to right)
- **Y-Axis (ΔP)**: Numerical scale from 0 to 80 (linear)
- **Legend**:
- Red bars = Q-Anchored
- Gray bars = A-Anchored
- **Chart Titles**:
- Left: "Mistral-7B-v0.1"
- Right: "Mistral-7B-v0.3"
### Detailed Analysis
#### Mistral-7B-v0.1
- **Q-Anchored**:
- PopQA: ~78
- TriviaQA: ~72
- HotpotQA: ~45
- NQ: ~44
- **A-Anchored**:
- PopQA: ~22
- TriviaQA: ~20
- HotpotQA: ~20
- NQ: ~3
#### Mistral-7B-v0.3
- **Q-Anchored**:
- PopQA: ~78
- TriviaQA: ~58
- HotpotQA: ~47
- NQ: ~54
- **A-Anchored**:
- PopQA: ~18
- TriviaQA: ~5
- HotpotQA: ~22
- NQ: ~4
### Key Observations
1. **Q-Anchored Dominance**: Q-Anchored consistently outperforms A-Anchored in both model versions across all datasets.
2. **Version-Specific Trends**:
- **v0.1**: Q-Anchored shows strong performance (72-78 range) in TriviaQA and PopQA.
- **v0.3**: Q-Anchored performance drops in TriviaQA (72 → 58) but improves in NQ (44 → 54).
3. **A-Anchored Variability**:
- TriviaQA shows a drastic drop (20 → 5) between versions.
- HotpotQA A-Anchored improves slightly (20 → 22) in v0.3.
4. **NQ Dataset**: A-Anchored performs poorly (<5) in both versions, suggesting limited effectiveness for this dataset.
### Interpretation
The data demonstrates that Q-Anchored methods are more robust and consistent across datasets and model versions. The performance drop in TriviaQA for v0.3 suggests potential version-specific limitations in handling trivia-based questions. The near-identical PopQA Q-Anchored scores (78 in both versions) indicate stability in this metric. The A-Anchored method's poor performance on NQ (≤5) highlights a critical weakness in this anchoring approach for knowledge-intensive tasks. The HotpotQA A-Anchored improvement in v0.3 (20 → 22) may reflect targeted optimizations, but the overall trend underscores the superiority of Q-Anchored methods in this evaluation framework.