## Directed Acyclic Graph (DAG): Source-to-Destination Lattice Network
### Overview
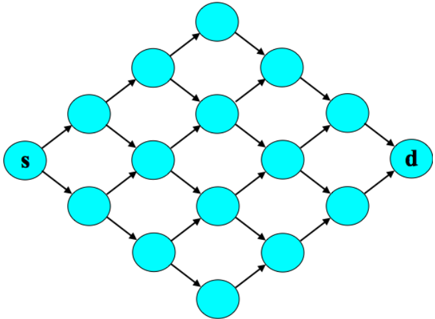
The image displays a directed acyclic graph (DAG) structured as a symmetrical, diamond-shaped lattice. It visually represents a network of pathways from a single source node to a single destination node through multiple intermediate layers. The graph is composed of cyan-colored circular nodes connected by black directional arrows, indicating a one-way flow from left to right.
### Components/Axes
* **Nodes:** 19 cyan-colored circular nodes in total.
* **Labeled Nodes:**
* **Source Node (s):** Located at the far left of the diagram. It is labeled with a lowercase, black letter "s".
* **Destination Node (d):** Located at the far right of the diagram. It is labeled with a lowercase, black letter "d".
* **Unlabeled Nodes:** 17 intermediate nodes with no textual labels.
* **Edges:** Black arrows connecting the nodes, indicating the direction of flow. Each arrow points from a node on the left to a node on the right.
* **Layout:** The nodes are arranged in a staggered, diagonal grid pattern forming a large diamond shape. The structure is symmetric about a horizontal axis running through the center.
### Detailed Analysis
**Structure and Flow:**
1. **Source Layer:** The graph begins with the single source node **'s'** on the left.
2. **Intermediate Layers:** From **'s'**, two arrows branch out to two nodes in the next layer. This pattern of branching and merging continues through approximately 6-7 vertical layers of nodes.
3. **Destination Layer:** All pathways ultimately converge into the single destination node **'d'** on the right.
4. **Connectivity Pattern:** Each intermediate node (except those on the top and bottom edges of the diamond) has two incoming arrows from the left and two outgoing arrows to the right. Nodes on the top and bottom edges have one incoming and one outgoing arrow, maintaining the diamond boundary.
5. **Pathways:** There are multiple distinct paths from **'s'** to **'d'**. A visual trace shows that any path from left to right must traverse exactly 8 nodes (including **'s'** and **'d'**), moving consistently rightward and either upward or downward at each step.
**Spatial Grounding:**
* The **'s'** node is positioned at the vertical center, far left.
* The **'d'** node is positioned at the vertical center, far right.
* The lattice expands symmetrically from the center line, reaching its maximum vertical spread at the middle layers before contracting back to the center line at **'d'**.
### Key Observations
* **Symmetry:** The graph exhibits perfect bilateral symmetry along the horizontal axis.
* **Deterministic Path Length:** Every possible path from **'s'** to **'d'** contains the same number of nodes and edges (8 nodes, 7 edges).
* **No Cycles:** The direction of all arrows is strictly left-to-right, confirming it is an acyclic graph.
* **Uniform Node Design:** All nodes are identical in size and color (cyan), with only **'s'** and **'d'** distinguished by text labels.
* **Absence of Other Text:** There are no axis labels, titles, legends, or numerical data present. The only textual information is the labels "s" and "d".
### Interpretation
This diagram is a classic representation of a **state-space lattice** or a **multistage graph**, commonly used in computer science, operations research, and network theory.
* **What it Demonstrates:** It models a process or system where a decision or flow starts at an initial state (**s**), progresses through a series of intermediate stages or states (the unlabeled nodes), and concludes at a final state (**d**). The multiple pathways represent different possible sequences of decisions or routes through the system.
* **Relationships:** The arrows define permissible transitions. The structure implies that at each stage (vertical layer), there are typically two choices (upward or downward diagonal move), leading to an exponential number of possible paths through the network.
* **Potential Applications:** This type of graph is fundamental for visualizing and analyzing:
* **Dynamic Programming:** Where the optimal path from **s** to **d** is found by solving subproblems at each node.
* **Network Flow:** Modeling the flow of goods, data, or traffic through a network with capacity constraints.
* **Parallel Computing:** Representing task dependencies in a pipeline.
* **Decision Processes:** Mapping out all possible decision sequences leading to an outcome.
* **Notable Anomaly:** The lack of any weights, costs, or capacities on the edges suggests this is a purely structural or topological diagram, focusing on connectivity and path existence rather than optimization or quantitative analysis.