# Technical Document Extraction: Sepsis Prediction Model (Training) Confusion Matrix
## 1. Document Header
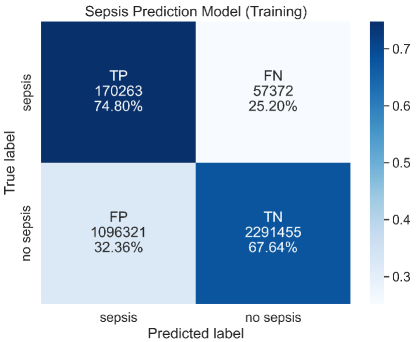
* **Title:** Sepsis Prediction Model (Training)
* **Language:** English
## 2. Component Isolation
### Region A: Axis Labels and Categories
* **Y-Axis (Vertical):** "True label"
* Categories: `sepsis` (Top), `no sepsis` (Bottom)
* **X-Axis (Horizontal):** "Predicted label"
* Categories: `sepsis` (Left), `no sepsis` (Right)
### Region B: Main Heatmap Data
The image is a 2x2 confusion matrix. Each cell contains a classification acronym, a raw count, and a percentage. The color intensity (blue) correlates with the percentage value within each row.
| True Label | Predicted: sepsis | Predicted: no sepsis | Row Totals (Calculated) |
| :--- | :--- | :--- | :--- |
| **sepsis** | **TP (True Positive)**<br>Count: 170,263<br>Percentage: 74.80% | **FN (False Negative)**<br>Count: 57,372<br>Percentage: 25.20% | 227,635 (100%) |
| **no sepsis** | **FP (False Positive)**<br>Count: 1,096,321<br>Percentage: 32.36% | **TN (True Negative)**<br>Count: 2,291,455<br>Percentage: 67.64% | 3,387,776 (100%) |
### Region C: Legend (Color Bar)
* **Spatial Placement:** Located on the far right of the image.
* **Type:** Continuous gradient scale.
* **Color Mapping:** Lightest blue/white represents lower values (~0.3), while dark navy blue represents higher values (~0.7+).
* **Markers:** 0.3, 0.4, 0.5, 0.6, 0.7.
## 3. Trend and Data Verification
### Spatial Grounding & Color Check
* **Top-Left (TP):** Darkest blue. Matches the >0.7 mark on the legend (Value: 74.80%).
* **Bottom-Right (TN):** Medium-Dark blue. Matches the ~0.67 mark on the legend (Value: 67.64%).
* **Bottom-Left (FP):** Light blue. Matches the ~0.32 mark on the legend (Value: 32.36%).
* **Top-Right (FN):** White/Very Light blue. Matches the <0.3 mark on the legend (Value: 25.20%).
### Visual Trend Analysis
1. **Diagonal Dominance:** The "True Positive" and "True Negative" cells (top-left to bottom-right diagonal) are significantly darker than the off-diagonal cells. This indicates the model has a higher rate of correct predictions than incorrect ones for both classes.
2. **Class Imbalance:** There is a massive disparity in raw counts. The "no sepsis" true labels (totaling over 3.3 million) far outnumber the "sepsis" true labels (totaling approximately 227k), indicating a highly imbalanced training dataset.
3. **Sensitivity vs. Specificity:**
* The model correctly identifies 74.80% of actual sepsis cases (Sensitivity/Recall).
* The model correctly identifies 67.64% of actual non-sepsis cases (Specificity).
## 4. Summary of Facts
* **Total Samples in Training Set:** 3,615,411
* **Correct Predictions (TP + TN):** 2,461,718
* **Incorrect Predictions (FP + FN):** 1,153,693
* **Primary Observation:** While the model captures nearly 75% of sepsis cases, it generates a high volume of False Positives (over 1 million), which is reflected in the relatively lower percentage of 67.64% for True Negatives.