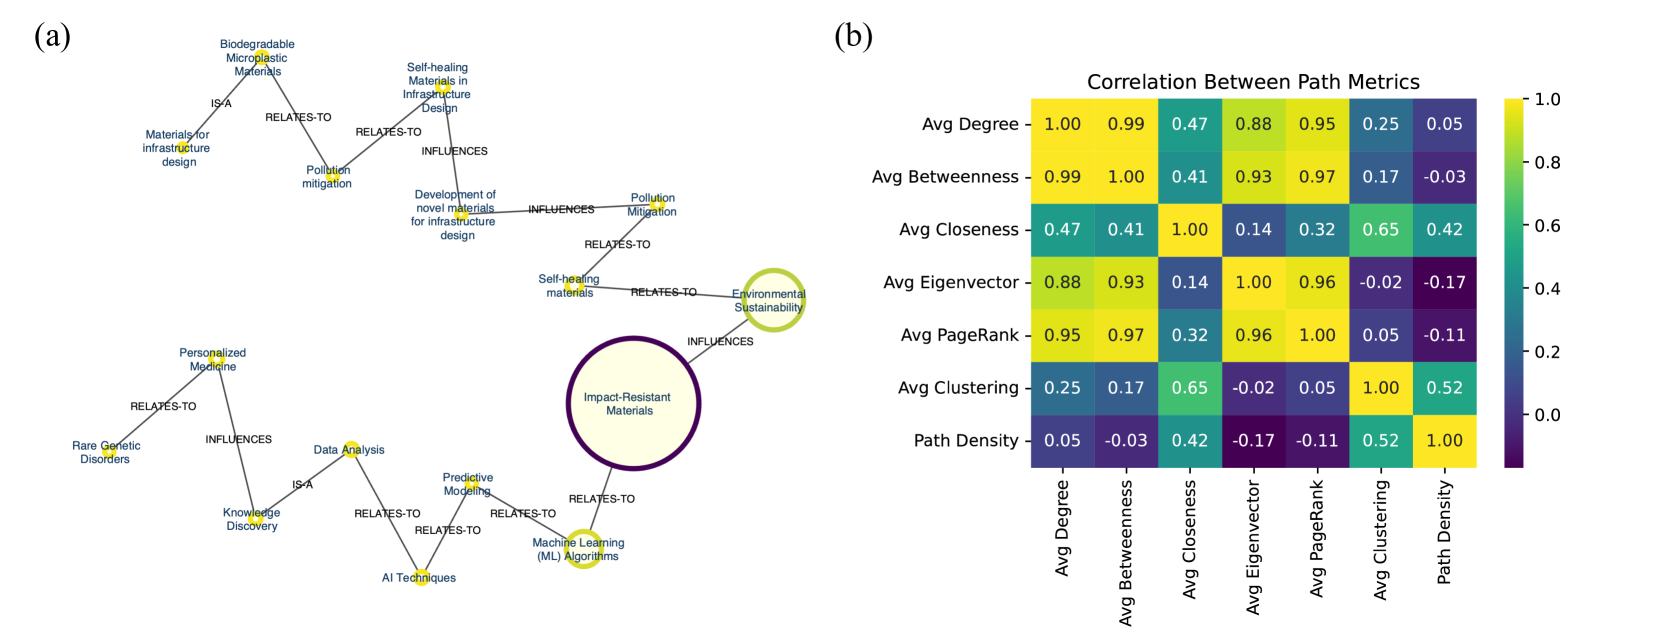
This image contains two distinct technical visualizations: (a) a concept map illustrating relationships between various research topics, and (b) a correlation heatmap analyzing network path metrics.
---
## (a) Concept Map: Research Topic Relationships
### Overview
This diagram is a network graph composed of two disconnected clusters of nodes. The nodes are represented by yellow circles of varying sizes, connected by lines (edges) that define the nature of the relationship between concepts. The graph appears to map research domains, specifically focusing on materials science/sustainability and AI/data analysis.
### Components
* **Nodes:** Represent specific research concepts.
* **Edges:** Labeled lines indicating the relationship type ("IS-A", "RELATES-TO", "INFLUENCES").
* **Visual Hierarchy:** The node "Impact-Resistant Materials" is significantly larger than others, followed by "Environmental Sustainability."
### Detailed Analysis
The graph is split into two distinct, non-connected components:
**Cluster 1 (Top-Left/Center): Materials and Sustainability**
* **Biodegradable Microplastic Materials** (IS-A) $\rightarrow$ **Materials for infrastructure design**
* **Biodegradable Microplastic Materials** (RELATES-TO) $\rightarrow$ **Pollution mitigation**
* **Pollution mitigation** (RELATES-TO) $\rightarrow$ **Self-healing Materials in Infrastructure Design**
* **Self-healing Materials in Infrastructure Design** (RELATES-TO) $\rightarrow$ **Development of novel materials for infrastructure design**
* **Development of novel materials for infrastructure design** (INFLUENCES) $\rightarrow$ **Pollution Mitigation**
* **Pollution Mitigation** (RELATES-TO) $\rightarrow$ **Self-healing materials**
* **Self-healing materials** (RELATES-TO) $\rightarrow$ **Environmental Sustainability**
* **Impact-Resistant Materials** (INFLUENCES) $\rightarrow$ **Environmental Sustainability**
**Cluster 2 (Bottom-Left): AI and Data Science**
* **Personalized Medicine** (RELATES-TO) $\rightarrow$ **Rare Genetic Disorders**
* **Personalized Medicine** (INFLUENCES) $\rightarrow$ **Knowledge Discovery**
* **Knowledge Discovery** (IS-A) $\rightarrow$ **Data Analysis**
* **Data Analysis** (RELATES-TO) $\rightarrow$ **Predictive Modeling**
* **Predictive Modeling** (RELATES-TO) $\rightarrow$ **Machine Learning (ML) Algorithms**
* **Predictive Modeling** (RELATES-TO) $\rightarrow$ **AI Techniques**
* **AI Techniques** (RELATES-TO) $\rightarrow$ **Machine Learning (ML) Algorithms**
### Interpretation
The diagram suggests a thematic separation between physical sciences (materials/sustainability) and computational sciences (AI/data analysis). The large size of "Impact-Resistant Materials" and "Environmental Sustainability" suggests these are central or high-priority nodes within the materials cluster. The lack of edges connecting the two clusters implies that, within the context of this specific dataset or literature review, these two domains are treated as distinct research areas.
---
## (b) Heatmap: Correlation Between Path Metrics
### Overview
This is a 7x7 correlation matrix visualizing the relationships between seven different network path metrics. The values range from -0.17 to 1.00. The color scale on the right indicates that yellow represents a high positive correlation (near 1.0), while dark purple represents low or negative correlation (near 0.0).
### Components/Axes
* **Variables (Rows and Columns):** Avg Degree, Avg Betweenness, Avg Closeness, Avg Eigenvector, Avg PageRank, Avg Clustering, Path Density.
* **Legend:** A vertical color bar on the right, ranging from 0.0 (dark purple) to 1.0 (bright yellow).
### Detailed Analysis
The following table reconstructs the correlation matrix:
| | Avg Degree | Avg Betweenness | Avg Closeness | Avg Eigenvector | Avg PageRank | Avg Clustering | Path Density |
| :--- | :---: | :---: | :---: | :---: | :---: | :---: | :---: |
| **Avg Degree** | 1.00 | 0.99 | 0.47 | 0.88 | 0.95 | 0.25 | 0.05 |
| **Avg Betweenness** | 0.99 | 1.00 | 0.41 | 0.93 | 0.97 | 0.17 | -0.03 |
| **Avg Closeness** | 0.47 | 0.41 | 1.00 | 0.14 | 0.32 | 0.65 | 0.42 |
| **Avg Eigenvector** | 0.88 | 0.93 | 0.14 | 1.00 | 0.96 | -0.02 | -0.17 |
| **Avg PageRank** | 0.95 | 0.97 | 0.32 | 0.96 | 1.00 | 0.05 | -0.11 |
| **Avg Clustering** | 0.25 | 0.17 | 0.65 | -0.02 | 0.05 | 1.00 | 0.52 |
| **Path Density** | 0.05 | -0.03 | 0.42 | -0.17 | -0.11 | 0.52 | 1.00 |
### Key Observations
* **High Correlation Cluster:** There is a very strong positive correlation (0.88 to 0.99) between **Avg Degree**, **Avg Betweenness**, **Avg Eigenvector**, and **Avg PageRank**. These metrics appear to measure similar structural properties of the network.
* **Moderate Correlation:** **Avg Closeness** shows a moderate positive correlation with **Avg Degree** (0.47) and **Avg Betweenness** (0.41), but a stronger correlation with **Avg Clustering** (0.65).
* **Negative/Low Correlation:** **Path Density** shows very low or negative correlations with the centrality metrics (Degree, Betweenness, Eigenvector, PageRank), indicating that as the network becomes denser, these specific centrality measures do not necessarily increase in a linear fashion.
### Interpretation
The data demonstrates that in the network being analyzed, standard centrality measures (Degree, Betweenness, Eigenvector, PageRank) are highly redundant, as they move in near-perfect unison. Conversely, **Avg Clustering** and **Path Density** behave differently, suggesting they capture distinct topological features of the network that are not captured by the primary centrality metrics. This heatmap is useful for feature selection in network analysis, as it identifies which metrics provide unique information versus those that are collinear.