\n
## Network Diagram & Correlation Heatmap: Interdisciplinary Relationships & Path Metric Correlations
### Overview
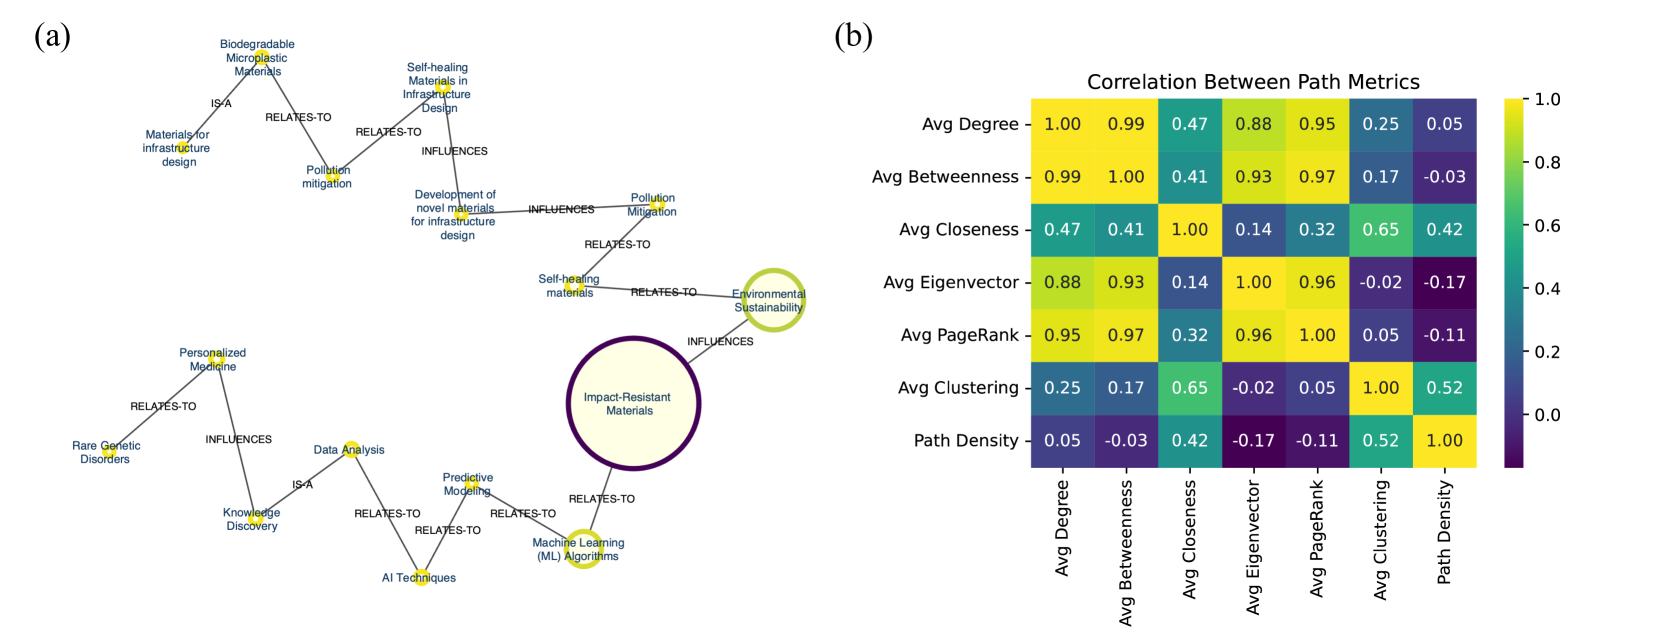
The image presents two distinct but related visualizations. Part (a) is a network diagram illustrating relationships between various fields of study and materials science. Part (b) is a heatmap displaying the correlation coefficients between different path metrics calculated on a network.
### Components/Axes
**Part (a): Network Diagram**
* **Nodes:** Biodegradable Microplastic Materials, Self-Healing Materials in Infrastructure Design, Materials for Infrastructure Design, Pollution Mitigation, Development of novel materials for infrastructure design, Environmental Sustainability, Impact-Resistant Materials, Personalized Medicine, Rare Genetic Disorders, Data Analysis, Predictive Modeling, Knowledge Discovery, AI Techniques, Machine Learning (ML) Algorithms, ISA.
* **Edges:** Labeled with relationships such as "RELATES TO", "INFLUENCES".
* **Spatial Arrangement:** Nodes are positioned in a circular arrangement, suggesting interconnectedness.
**Part (b): Correlation Heatmap**
* **Rows:** Avg Degree, Avg Betweenness, Avg Closeness, Avg Eigenvector, Avg PageRank, Avg Clustering, Path Density.
* **Columns:** Avg Degree, Avg Betweenness, Avg Closeness, Avg Eigenvector, Avg PageRank, Avg Clustering, Path Density.
* **Color Scale:** Ranges from blue (negative correlation, approximately -1.0) to red (positive correlation, approximately 1.0), with white representing no correlation (approximately 0.0).
* **Values:** Correlation coefficients displayed within each cell of the heatmap.
### Detailed Analysis or Content Details
**Part (a): Network Diagram**
* **Biodegradable Microplastic Materials** RELATES TO **Self-Healing Materials in Infrastructure Design**.
* **Self-Healing Materials in Infrastructure Design** RELATES TO **Materials for Infrastructure Design**.
* **Materials for Infrastructure Design** INFLUENCES **Pollution Mitigation**.
* **Pollution Mitigation** INFLUENCES **Development of novel materials for infrastructure design**.
* **Development of novel materials for infrastructure design** RELATES TO **Environmental Sustainability**.
* **Environmental Sustainability** RELATES TO **Self-Healing Materials**.
* **Self-Healing Materials** INFLUENCES **Impact-Resistant Materials**.
* **Personalized Medicine** INFLUENCES **Rare Genetic Disorders**.
* **Rare Genetic Disorders** RELATES TO **ISA**.
* **ISA** RELATES TO **Knowledge Discovery**.
* **Knowledge Discovery** RELATES TO **Predictive Modeling**.
* **Predictive Modeling** RELATES TO **Machine Learning (ML) Algorithms**.
* **Machine Learning (ML) Algorithms** RELATES TO **Data Analysis**.
* **Data Analysis** INFLUENCES **Rare Genetic Disorders**.
**Part (b): Correlation Heatmap**
The heatmap displays the correlation between various network path metrics. Here's a breakdown of the values, noting approximate values due to image resolution:
* **Avg Degree:** Self-correlation is 1.00. Positive correlations with Avg Betweenness (0.99), Avg Eigenvector (0.88), Avg PageRank (0.95), and Avg Clustering (0.25). Negative correlation with Path Density (-0.03).
* **Avg Betweenness:** Self-correlation is 1.00. Positive correlations with Avg Degree (0.99), Avg Eigenvector (0.83), Avg PageRank (0.97). Negative correlation with Path Density (-0.17).
* **Avg Closeness:** Self-correlation is 1.00. Positive correlations with Avg Degree (0.47), Avg Betweenness (0.41), Avg Eigenvector (0.14), Avg PageRank (0.32), and Avg Clustering (0.65). Negative correlation with Path Density (-0.42).
* **Avg Eigenvector:** Self-correlation is 1.00. Positive correlations with Avg Degree (0.88), Avg Betweenness (0.83), Avg PageRank (0.96). Negative correlation with Path Density (-0.11).
* **Avg PageRank:** Self-correlation is 1.00. Positive correlations with Avg Degree (0.95), Avg Betweenness (0.97), Avg Eigenvector (0.96). Negative correlation with Path Density (-0.05).
* **Avg Clustering:** Self-correlation is 1.00. Positive correlation with Avg Closeness (0.65). Negative correlation with Path Density (-0.17).
* **Path Density:** Self-correlation is 1.00. Negative correlations with Avg Degree (-0.03), Avg Betweenness (-0.17), Avg Closeness (-0.42), Avg Eigenvector (-0.11), and Avg PageRank (-0.05).
### Key Observations
* **Part (a):** The network diagram highlights the interconnectedness of materials science with broader fields like medicine, AI, and environmental sustainability. The "ISA" node appears to be a central connector between genetic research and knowledge discovery.
* **Part (b):** Strong positive correlations exist between Avg Degree, Avg Betweenness, Avg Eigenvector, and Avg PageRank. This suggests that nodes with high degree centrality also tend to have high betweenness, eigenvector, and PageRank scores. Path Density consistently shows negative correlations with most other metrics, indicating that networks with higher path density tend to have different structural properties. Avg Clustering has relatively weak correlations with most other metrics.
### Interpretation
The image suggests a holistic view of materials science, extending beyond traditional engineering disciplines to encompass biological and computational fields. The network diagram illustrates how advancements in one area can influence others, emphasizing the importance of interdisciplinary collaboration.
The correlation heatmap provides insights into the relationships between different network properties. The strong correlations between degree, betweenness, eigenvector, and PageRank suggest that these metrics often capture similar aspects of network structure – identifying influential nodes. The negative correlation between Path Density and these centrality measures indicates that denser networks may exhibit different patterns of influence and connectivity.
The combination of these visualizations suggests that understanding the interplay between network structure and interdisciplinary connections is crucial for driving innovation in materials science and related fields. The ISA node's central position in the network diagram, coupled with the correlations observed in the heatmap, could indicate that standardized data formats and knowledge sharing play a vital role in facilitating these connections.