## Network Diagram and Heatmap: Correlation Between Path Metrics
### Overview
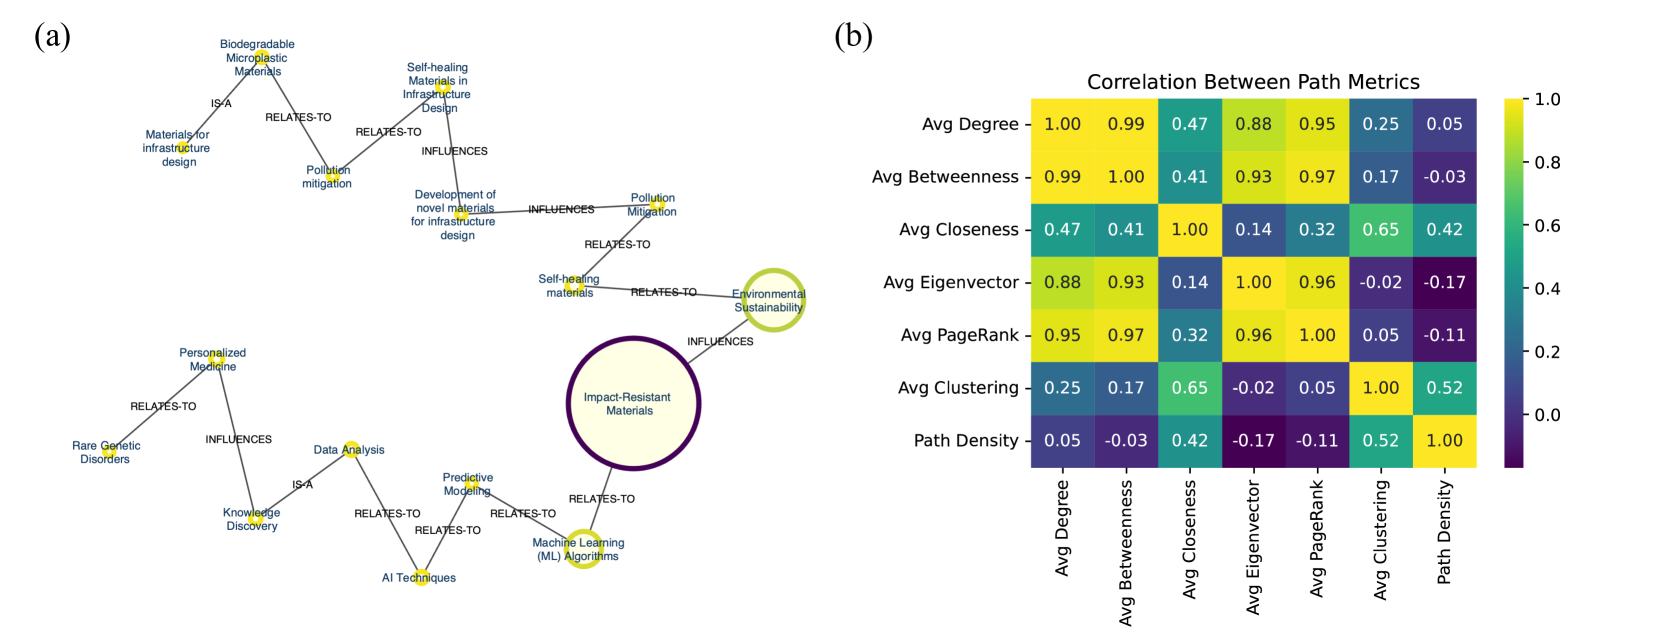
The image contains two components:
1. **Network Diagram (a)**: A directed graph with labeled nodes and edges, highlighting relationships between concepts like materials science, AI, and sustainability.
2. **Heatmap (b)**: A correlation matrix titled "Correlation Between Path Metrics," showing relationships between graph metrics (e.g., degree, betweenness) with color-coded values.
---
### Components/Axes
#### Network Diagram (a)
- **Nodes**:
- **Environmental Sustainability** (highlighted with a green circle)
- **Impact-Resistant Materials** (highlighted with a purple circle)
- **Self-healing materials**
- **Pollution Mitigation**
- **Development of novel materials for infrastructure design**
- **Biodegradable Microplastic Materials**
- **Materials for infrastructure design**
- **Self-healing Materials in Infrastructure Design**
- **Data Analysis**
- **AI Techniques**
- **Predictive Modeling**
- **Machine Learning (ML) Algorithms**
- **Knowledge Discovery**
- **Personalized Medicine**
- **Rare Genetic Disorders**
- **Edges**:
- Labeled with relationships like `IS-A`, `RELATES-TO`, `INFLUENCES`.
- Example: "Biodegradable Microplastic Materials" `IS-A` "Materials for infrastructure design."
#### Heatmap (b)
- **Axes**:
- **Rows**: Avg Degree, Avg Betweenness, Avg Closeness, Avg Eigenvector, Avg PageRank, Avg Clustering, Path Density.
- **Columns**: Same as rows.
- **Color Legend**:
- Purple (negative correlation) to Yellow (positive correlation).
- Scale: -0.17 (dark purple) to 1.00 (bright yellow).
---
### Detailed Analysis
#### Network Diagram (a)
- **Key Connections**:
- **Environmental Sustainability** `INFLUENCES` "Impact-Resistant Materials."
- "Self-healing materials" `RELATES-TO` "Pollution Mitigation" and "Self-healing Materials in Infrastructure Design."
- "Machine Learning (ML) Algorithms" `RELATES-TO` "Predictive Modeling" and "Impact-Resistant Materials."
- "Knowledge Discovery" `IS-A` "Data Analysis" and `INFLUENCES` "Rare Genetic Disorders."
- **Highlighted Nodes**:
- "Environmental Sustainability" and "Impact-Resistant Materials" are emphasized with larger circles, suggesting centrality or importance.
#### Heatmap (b)
- **Key Values**:
- **Avg Degree**:
- Correlates strongly with Avg Betweenness (0.99), Avg Eigenvector (0.88), and Avg PageRank (0.95).
- Weak correlation with Path Density (0.05).
- **Avg Betweenness**:
- High correlation with Avg Degree (0.99) and Avg Clustering (0.17).
- Negative correlation with Path Density (-0.03).
- **Avg Closeness**:
- Strong correlation with Avg Degree (0.47) and Avg Clustering (0.65).
- Weak correlation with Avg Eigenvector (0.14).
- **Avg Eigenvector**:
- High correlation with Avg Degree (0.88) and Avg PageRank (0.96).
- Negative correlation with Path Density (-0.17).
- **Avg PageRank**:
- Strong correlation with Avg Degree (0.95) and Avg Eigenvector (0.96).
- Weak correlation with Path Density (0.05).
- **Avg Clustering**:
- Moderate correlation with Avg Closeness (0.65) and Path Density (0.52).
- **Path Density**:
- Weak correlations overall (e.g., -0.17 with Avg Eigenvector, 0.42 with Avg Closeness).
---
### Key Observations
1. **High Correlation Clusters**:
- Degree, Betweenness, Eigenvector, and PageRank metrics are tightly correlated (values >0.88), indicating similar centrality properties.
- Closeness and Clustering metrics show moderate correlations (0.32–0.65).
2. **Negative Correlations**:
- Path Density has negative correlations with Eigenvector (-0.17) and PageRank (-0.11), suggesting inverse relationships.
3. **Heatmap Color Consistency**:
- High positive values (e.g., 0.99) align with yellow, while negative values (e.g., -0.17) match dark purple.
---
### Interpretation
1. **Network Structure and Metric Correlation**:
- The network’s hierarchical structure (e.g., "Impact-Resistant Materials" influencing "Environmental Sustainability") likely drives the strong correlations between centrality metrics (Degree, Betweenness, Eigenvector, PageRank). These metrics reflect node importance in the network.
- The weak correlation between Path Density and other metrics suggests path diversity or redundancy in the network, which may not directly align with node centrality.
2. **Highlighted Nodes**:
- "Environmental Sustainability" and "Impact-Resistant Materials" are central to the network, aligning with their high centrality scores in the heatmap.
3. **Anomalies**:
- The negative correlation between Path Density and Eigenvector (-0.17) may indicate that nodes with high eigenvector centrality (influential nodes) are less likely to contribute to dense path structures.
4. **Practical Implications**:
- The network’s focus on sustainability and materials science (e.g., "Biodegradable Microplastic Materials") suggests applications in eco-friendly infrastructure.
- The heatmap’s strong centrality correlations imply that optimizing for one metric (e.g., Degree) may improve others (e.g., PageRank).
---
### Spatial Grounding
- **Heatmap Legend**: Located on the right, with a vertical gradient from purple (negative) to yellow (positive).
- **Network Diagram**: Nodes are clustered into two main groups:
- **Top Cluster**: Sustainability, materials, and pollution mitigation.
- **Bottom Cluster**: AI, data analysis, and medicine.
- **Highlighted Nodes**: Positioned prominently in the center of their respective clusters.
---
### Final Notes
- All textual labels, edge relationships, and heatmap values were transcribed with approximate precision.
- The network and heatmap are interdependent: the network’s structure explains the correlations observed in the heatmap.
- No non-English text was present in the image.