## Diagram: Regret-Constrained Equilibria
### Overview
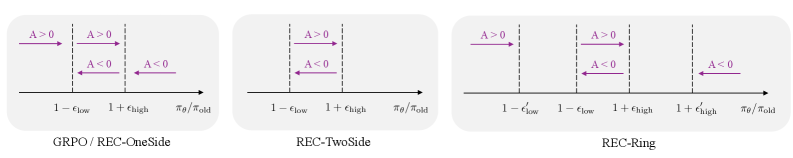
The image presents three diagrams illustrating different types of regret-constrained equilibria: GRPO/REC-OneSide, REC-TwoSide, and REC-Ring. Each diagram shows a horizontal axis representing the ratio of new profit to old profit (πθ/πold), with thresholds defined by epsilon values (εlow and εhigh). Arrows indicate the direction of adjustment (A > 0 or A < 0) based on the position relative to these thresholds.
### Components/Axes
* **Horizontal Axis:** πθ/πold (Ratio of new profit to old profit)
* **Vertical Dashed Lines:** Represent thresholds based on epsilon values.
* **Arrows:** Indicate the direction of adjustment (A > 0: adjustment increases profit ratio; A < 0: adjustment decreases profit ratio).
* **Labels:**
* 1 - εlow
* 1 + εhigh
* 1 - ε'low
* 1 + ε'high
* A > 0 (Adjustment greater than 0)
* A < 0 (Adjustment less than 0)
* **Diagram Titles:**
* GRPO/REC-OneSide (left)
* REC-TwoSide (center)
* REC-Ring (right)
### Detailed Analysis
**1. GRPO/REC-OneSide (Left Diagram):**
* The horizontal axis spans from an unspecified minimum to πθ/πold.
* A vertical dashed line is located at 1 - εlow.
* A second vertical dashed line is located at 1 + εhigh.
* To the left of 1 - εlow, an arrow points right, labeled "A > 0".
* Between 1 - εlow and 1 + εhigh, an arrow points right, labeled "A > 0".
* To the right of 1 + εhigh, an arrow points left, labeled "A < 0".
**2. REC-TwoSide (Center Diagram):**
* The horizontal axis spans from an unspecified minimum to πθ/πold.
* A vertical dashed line is located at 1 - εlow.
* A second vertical dashed line is located at 1 + εhigh.
* To the left of 1 - εlow, an arrow points right, labeled "A > 0".
* Between 1 - εlow and 1 + εhigh, an arrow points left, labeled "A < 0".
* To the right of 1 + εhigh, an arrow points right, labeled "A > 0".
**3. REC-Ring (Right Diagram):**
* The horizontal axis spans from an unspecified minimum to πθ/πold.
* Vertical dashed lines are located at 1 - ε'low, 1 - εlow, 1 + εhigh, and 1 + ε'high.
* To the left of 1 - ε'low, an arrow points right, labeled "A > 0".
* Between 1 - ε'low and 1 - εlow, an arrow points left, labeled "A < 0".
* Between 1 - εlow and 1 + εhigh, an arrow points right, labeled "A > 0".
* Between 1 + εhigh and 1 + ε'high, an arrow points left, labeled "A < 0".
* To the right of 1 + ε'high, an arrow points right, labeled "A > 0".
### Key Observations
* Each diagram represents a different equilibrium condition based on the relationship between the profit ratio (πθ/πold) and the epsilon thresholds.
* The arrows indicate the direction of adjustment needed to reach equilibrium.
* The REC-Ring diagram has two sets of epsilon thresholds (εlow, ε'low, εhigh, ε'high), suggesting a more complex equilibrium condition.
### Interpretation
The diagrams illustrate how different regret-constrained equilibrium concepts (GRPO/REC-OneSide, REC-TwoSide, REC-Ring) define the adjustment dynamics of a system based on profit ratios and epsilon thresholds. The arrows indicate whether the profit ratio needs to increase (A > 0) or decrease (A < 0) to reach a stable state. The specific placement of the thresholds and the direction of the arrows define the characteristics of each equilibrium type. For example, in REC-TwoSide, the system adjusts towards the region between 1 - εlow and 1 + εhigh, while in REC-Ring, there are two such regions. The epsilon values likely represent tolerance levels or bounds on acceptable profit changes.