\n
## Diagram: Reflection Configurations
### Overview
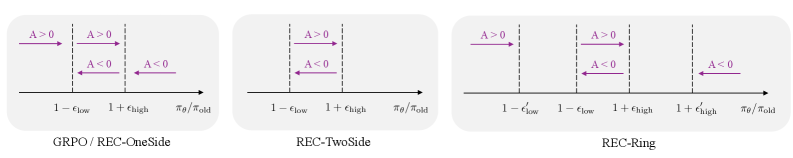
The image presents three diagrams illustrating different reflection configurations: GRPO/REC-OneSide, REC-TwoSide, and REC-Ring. Each diagram depicts a horizontal line representing a range, with arrows indicating reflection events and labels denoting conditions related to a parameter 'A'.
### Components/Axes
Each diagram shares the following components:
* **Horizontal Axis:** Labeled with "1 - 𝑐𝑙𝑜𝑤", "1 + 𝑐ℎ𝑖𝑔ℎ", and "𝜋/𝜎𝑜𝑙𝑑". These represent positions or values along the line.
* **Arrows:** Purple arrows indicate the direction of reflection.
* **Labels:** "A > 0" and "A < 0" are placed above and below the arrows, respectively, indicating the sign of the parameter 'A' during reflection.
* **Diagram Titles:** Each diagram has a title identifying the specific reflection configuration.
### Detailed Analysis or Content Details
**1. GRPO/REC-OneSide:**
* A single arrow pointing to the left is labeled "A > 0". It originates from the left end of the line and extends towards the center.
* A single arrow pointing to the right is labeled "A < 0". It originates from the center of the line and extends towards the right end.
* The horizontal axis is marked with "1 - 𝑐𝑙𝑜𝑤", "1 + 𝑐ℎ𝑖𝑔ℎ", and "𝜋/𝜎𝑜𝑙𝑑" from left to right.
**2. REC-TwoSide:**
* An arrow pointing to the left is labeled "A > 0". It originates from the left end of the line and extends towards the center.
* An arrow pointing to the right is labeled "A < 0". It originates from the center of the line and extends towards the right end.
* A second arrow pointing to the left is labeled "A < 0". It originates from the right end of the line and extends towards the center.
* The horizontal axis is marked with "1 - 𝑐𝑙𝑜𝑤", "1 + 𝑐ℎ𝑖𝑔ℎ", and "𝜋/𝜎𝑜𝑙𝑑" from left to right.
**3. REC-Ring:**
* An arrow pointing to the left is labeled "A > 0". It originates from the left end of the line and extends towards the center.
* An arrow pointing to the right is labeled "A < 0". It originates from the center of the line and extends towards the right end.
* A second arrow pointing to the left is labeled "A > 0". It originates from the right end of the line and extends towards the center.
* A second arrow pointing to the right is labeled "A < 0". It originates from the center of the line and extends towards the right end.
* The horizontal axis is marked with "1 - 𝑐𝑙𝑜𝑤", "1 + 𝑐ℎ𝑖𝑔ℎ", and "𝜋/𝜎𝑜𝑙𝑑" from left to right.
### Key Observations
* The diagrams illustrate how the sign of 'A' changes during reflection in different configurations.
* GRPO/REC-OneSide shows a single reflection event with a sign change.
* REC-TwoSide shows two reflection events, with a sign change in each.
* REC-Ring shows two reflection events, with a sign change in each.
### Interpretation
The diagrams likely represent different methods or scenarios for reflecting a signal or wave. The parameter 'A' could represent amplitude, intensity, or another relevant property. The horizontal axis represents a range of values or positions. The diagrams demonstrate how the sign of 'A' is affected by the reflection process in each configuration. The configurations suggest different boundary conditions or geometries. GRPO/REC-OneSide represents a reflection from a single boundary, REC-TwoSide represents reflections from two boundaries, and REC-Ring represents a cyclic or closed-loop reflection scenario. The labels "1 - 𝑐𝑙𝑜𝑤", "1 + 𝑐ℎ𝑖𝑔ℎ", and "𝜋/𝜎𝑜𝑙𝑑" likely define the boundaries or limits of the reflection domain, and their specific meanings would depend on the context of the application.