## Diagram Type: Control System Behavior Schematics
### Overview
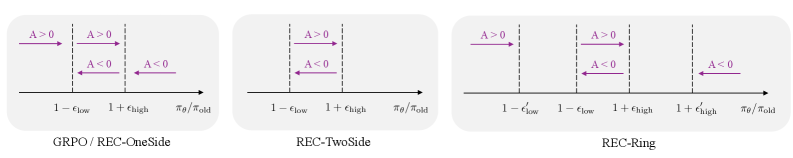
The image contains three technical diagrams illustrating control system behavior under different conditions. Each diagram uses directional arrows labeled with "A > 0" (positive effect) and "A < 0" (negative effect) to represent system responses across normalized parameter ranges. The diagrams are labeled GRPO/REC-OneSide, REC-TwoSide, and REC-Ring, with distinct configurations of dashed boundary lines and arrow placements.
### Components/Axes
1. **X-Axis**:
- Labeled as `πθ/πold` (normalized parameter ratio).
- GRPO/REC-OneSide: Ranges from `1 - εlow` to `1 + εhigh`.
- REC-TwoSide: Ranges from `1 - εlow` to `1 + εhigh`.
- REC-Ring: Ranges from `1 - ε'_low` to `1 + ε'_high`, with intermediate markers at `1 - εlow` and `1 + εhigh`.
2. **Y-Axis**:
- Not explicitly labeled; diagrams appear to represent 1D parameter space.
3. **Legends**:
- Purple arrows indicate:
- `A > 0` (rightward arrows, positive effect).
- `A < 0` (leftward arrows, negative effect).
4. **Dashed Lines**:
- Vertical boundaries marking critical thresholds (e.g., `1 ± εlow`, `1 ± εhigh`).
### Detailed Analysis
#### GRPO/REC-OneSide
- **Structure**: Two vertical dashed lines at `1 - εlow` and `1 + εhigh`.
- **Arrows**:
- Left of `1 - εlow`: `A < 0` (leftward).
- Between `1 - εlow` and `1 + εhigh`: `A > 0` (rightward).
- Right of `1 + εhigh`: `A < 0` (leftward).
#### REC-TwoSide
- **Structure**: Single vertical dashed line at `1 - εlow`.
- **Arrows**:
- Left of `1 - εlow`: `A < 0` (leftward).
- Right of `1 - εlow`: `A > 0` (rightward).
#### REC-Ring
- **Structure**: Two vertical dashed lines at `1 - εlow` and `1 + εhigh`, with additional markers at `1 - ε'_low` and `1 + ε'_high`.
- **Arrows**:
- Left of `1 - ε'_low`: `A > 0` (rightward).
- Between `1 - εlow` and `1 + εhigh`: `A > 0` (rightward) and `A < 0` (leftward).
- Right of `1 + ε'_high`: `A < 0` (leftward).
### Key Observations
1. **Boundary Sensitivity**:
- GRPO/REC-OneSide shows bidirectional instability outside `1 ± εlow/εhigh`.
- REC-TwoSide simplifies to a single threshold (`1 - εlow`), with uniform behavior on either side.
- REC-Ring introduces asymmetric thresholds (`ε'_low`/`ε'_high`), creating a "ring" of mixed effects between `1 - εlow` and `1 + εhigh`.
2. **Arrow Consistency**:
- All diagrams use purple arrows matching the legend.
- Directionality aligns with parameter magnitude (e.g., `A > 0` dominates in central regions).
3. **Threshold Variability**:
- REC-Ring distinguishes between primed (`ε'_low/ε'_high`) and unprimed (`εlow/εhigh`) thresholds, suggesting adaptive or hierarchical control logic.
### Interpretation
These diagrams likely model system stability or performance in control theory, where:
- `A` represents a control parameter (e.g., gain, error).
- `πθ/πold` normalizes the parameter relative to a baseline (`πold`).
- `ε` terms define allowable deviation ranges for stability.
- **GRPO/REC-OneSide**: Represents a system where deviations beyond `1 ± εlow/εhigh` destabilize the parameter (`A < 0`), while central deviations stabilize it (`A > 0`).
- **REC-TwoSide**: Simplifies to a single critical threshold (`1 - εlow`), with opposing effects on either side.
- **REC-Ring**: Introduces a "safe zone" between `1 - εlow` and `1 + εhigh` where bidirectional effects (`A > 0` and `A < 0`) coexist, possibly indicating nonlinear interactions. The primed thresholds (`ε'_low/ε'_high`) may reflect adaptive adjustments in dynamic environments.
The schematics emphasize how parameter normalization and threshold design influence system behavior, with REC-Ring suggesting a more complex, context-dependent control strategy.