# Technical Document Extraction: Image Analysis
## Overview
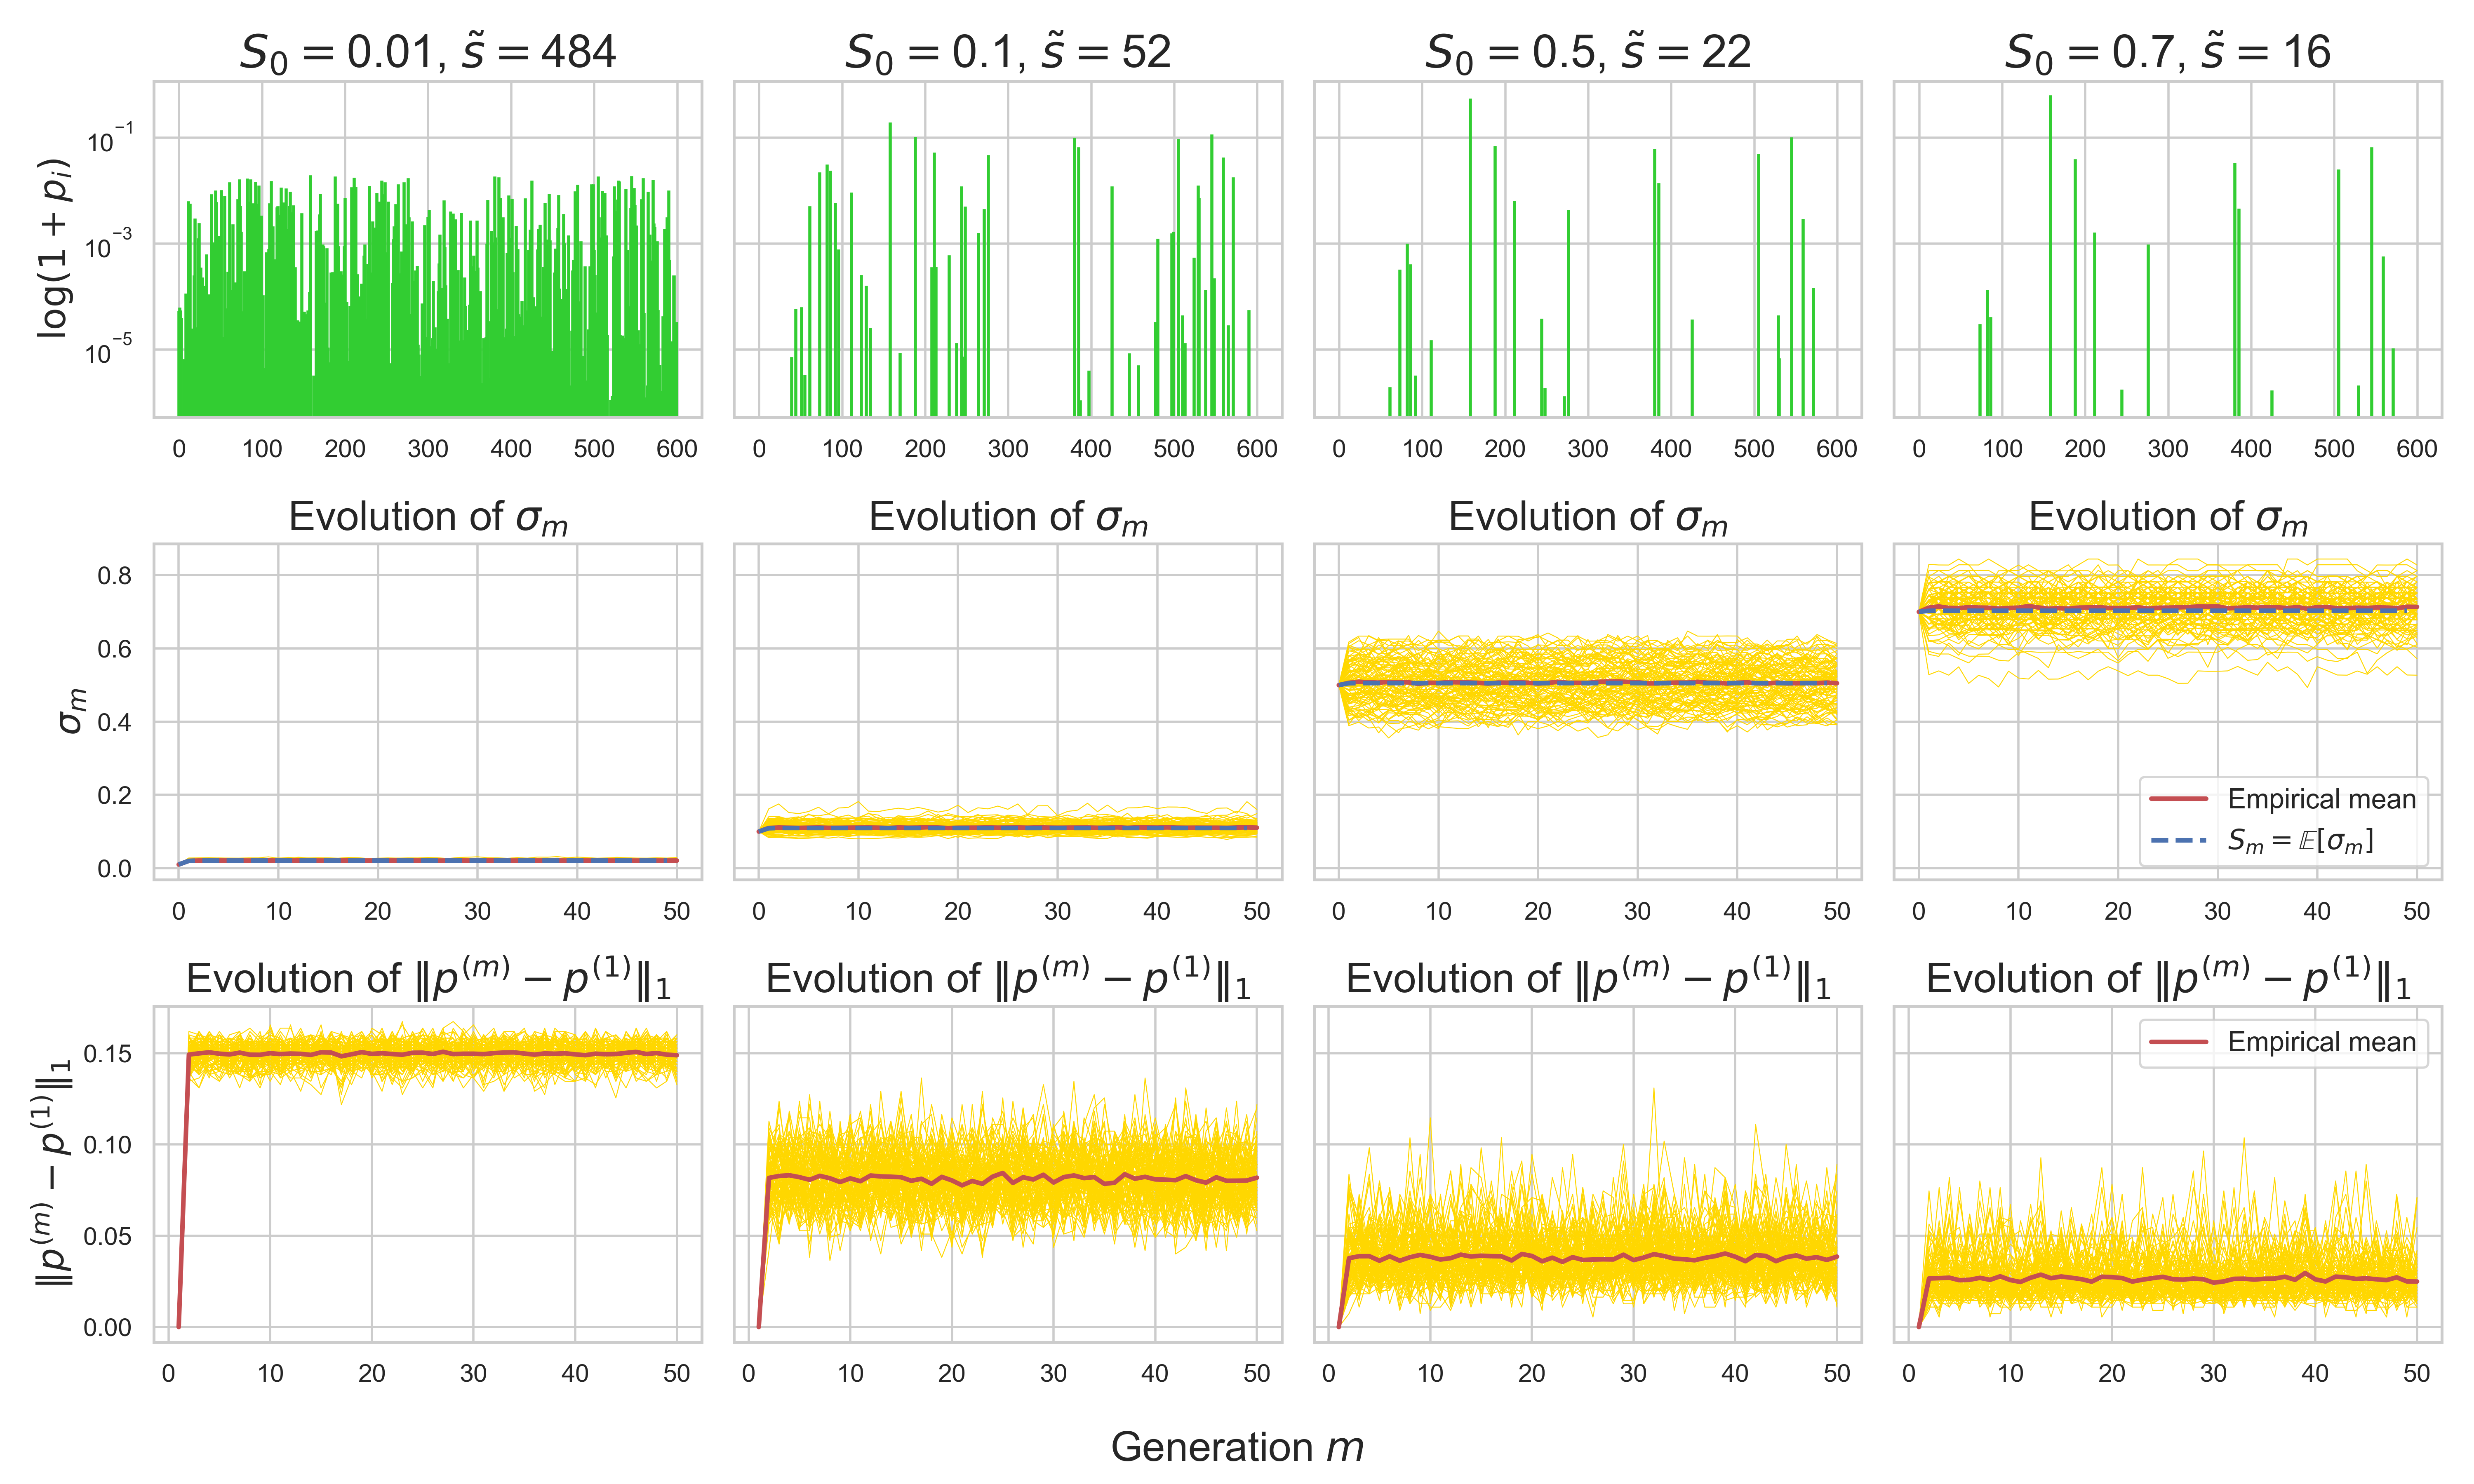
The image contains four comparative panels, each depicting three subplots for different parameter settings:
- **Top Row**: Histograms of `log(1 + p_i)` distributions across generations (0–600).
- **Middle Row**: Evolution of `σ_m` (standard deviation) over generations (0–50).
- **Bottom Row**: Evolution of `||p^(m) - p^(1)||₁` (L1 norm difference) over generations (0–50).
Parameters vary across panels:
1. `S₀ = 0.01, σ̃ = 484`
2. `S₀ = 0.1, σ̃ = 52`
3. `S₀ = 0.5, σ̃ = 22`
4. `S₀ = 0.7, σ̃ = 16`
---
## Panel 1: `S₀ = 0.01, σ̃ = 484`
### Histogram of `log(1 + p_i)`
- **Y-axis**: `log(1 + p_i)` (logarithmic scale, 10⁻⁵ to 10⁻¹).
- **X-axis**: Generation `m` (0–600).
- **Key Trends**:
- Dense, uniform distribution of green bars.
- No significant peaks or valleys.
### Evolution of `σ_m`
- **Y-axis**: `σ_m` (0–0.8).
- **X-axis**: Generation `m` (0–50).
- **Key Trends**:
- Empirical mean (red line) and `E[σ_m]` (blue dashed) converge to **~0.01**.
- Minimal fluctuation after generation 10.
### Evolution of `||p^(m) - p^(1)||₁`
- **Y-axis**: Norm difference (0–0.15).
- **X-axis**: Generation `m` (0–50).
- **Key Trends**:
- Sharp drop to **~0.05** by generation 10.
- Stabilizes with minor oscillations.
---
## Panel 2: `S₀ = 0.1, σ̃ = 52`
### Histogram of `log(1 + p_i)`
- **Y-axis**: `log(1 + p_i)` (logarithmic scale, 10⁻⁵ to 10⁻¹).
- **X-axis**: Generation `m` (0–600).
- **Key Trends**:
- Moderate density of green bars.
- Slight clustering around mid-range values.
### Evolution of `σ_m`
- **Y-axis**: `σ_m` (0–0.8).
- **X-axis**: Generation `m` (0–50).
- **Key Trends**:
- Empirical mean (red) and `E[σ_m]` (blue dashed) stabilize at **~0.05**.
- Slight upward trend in early generations.
### Evolution of `||p^(m) - p^(1)||₁`
- **Y-axis**: Norm difference (0–0.15).
- **X-axis**: Generation `m` (0–50).
- **Key Trends**:
- Gradual decline to **~0.1** by generation 30.
- Persistent noise in later generations.
---
## Panel 3: `S₀ = 0.5, σ̃ = 22`
### Histogram of `log(1 + p_i)`
- **Y-axis**: `log(1 + p_i)` (logarithmic scale, 10⁻⁵ to 10⁻¹).
- **X-axis**: Generation `m` (0–600).
- **Key Trends**:
- Sparse green bars.
- Dominant peak near `log(1 + p_i) ≈ 10⁻²`.
### Evolution of `σ_m`
- **Y-axis**: `σ_m` (0–0.8).
- **X-axis**: Generation `m` (0–50).
- **Key Trends**:
- Empirical mean (red) and `E[σ_m]` (blue dashed) converge to **~0.4**.
- Sharp increase after generation 20.
### Evolution of `||p^(m) - p^(1)||₁`
- **Y-axis**: Norm difference (0–0.15).
- **X-axis**: Generation `m` (0–50).
- **Key Trends**:
- Rapid drop to **~0.08** by generation 10.
- High variability in later generations.
---
## Panel 4: `S₀ = 0.7, σ̃ = 16`
### Histogram of `log(1 + p_i)`
- **Y-axis**: `log(1 + p_i)` (logarithmic scale, 10⁻⁵ to 10⁻¹).
- **X-axis**: Generation `m` (0–600).
- **Key Trends**:
- Very sparse green bars.
- Dominant peak near `log(1 + p_i) ≈ 10⁻¹`.
### Evolution of `σ_m`
- **Y-axis**: `σ_m` (0–0.8).
- **X-axis**: Generation `m` (0–50).
- **Key Trends**:
- Empirical mean (red) and `E[σ_m]` (blue dashed) stabilize at **~0.8**.
- Minimal fluctuation after generation 10.
### Evolution of `||p^(m) - p^(1)||₁`
- **Y-axis**: Norm difference (0–0.15).
- **X-axis**: Generation `m` (0–50).
- **Key Trends**:
- Sharp drop to **~0.05** by generation 5.
- Persistent noise with occasional spikes.
---
## Legend and Spatial Grounding
- **Legend Location**: Bottom-right corner of each panel.
- **Legend Entries**:
- **Red Line**: Empirical mean.
- **Blue Dashed Line**: `E[σ_m]` (standard deviation expectation).
- **Color Consistency**:
- Red lines match empirical mean trends across all panels.
- Blue dashed lines align with `E[σ_m]` in σ_m subplots.
---
## Component Isolation
### Histograms
- **Region**: Top row of each panel.
- **Observations**:
- Higher `S₀` values correlate with sparser distributions.
- `σ̃` inversely affects bar density (e.g., `σ̃ = 484` vs. `σ̃ = 16`).
### σ_m Evolution
- **Region**: Middle row of each panel.
- **Observations**:
- `σ_m` increases with `S₀` (0.01 → 0.8).
- `E[σ_m]` (blue dashed) closely tracks empirical mean (red).
### Norm Evolution
- **Region**: Bottom row of each panel.
- **Observations**:
- `||p^(m) - p^(1)||₁` decreases with higher `S₀`.
- Noise levels increase for larger `S₀` values.
---
## Final Notes
- **Language**: All text is in English.
- **Data Tables**: No explicit tables; histograms and line plots represent data.
- **Missing Information**: No textual annotations beyond axis labels and legends.