\n
## Diagram: Computational Graph and Thought Simulation
### Overview
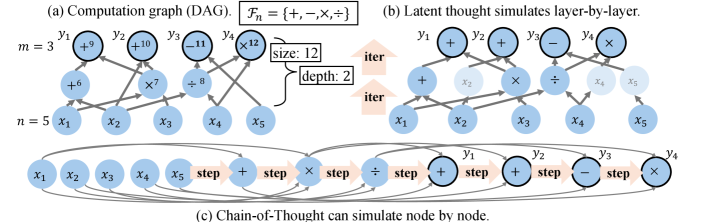
The image presents three diagrams illustrating different approaches to computation and thought simulation. Diagram (a) depicts a computation graph (Directed Acyclic Graph - DAG) with labeled nodes and edges. Diagram (b) shows a latent thought process simulated layer-by-layer, and diagram (c) illustrates a Chain-of-Thought approach simulating node by node. The diagrams are arranged horizontally, with (c) positioned below (a) and (b).
### Components/Axes
**Diagram (a): Computation Graph (DAG)**
* **Label:** `Fₙ = {−, ×, ÷, +}`
* **Variables:** `m = 3`, `n = 5`
* **Nodes:** `y₁, y₂, y₃, y₄, x₁, x₂, x₃, x₄, x₅`
* **Edge Labels:** `+6`, `+9`, `+10`, `-11`, `×12`, `×7`, `×8`
* **Box:** "size: 12", "depth: 2"
**Diagram (b): Latent Thought simulates layer-by-layer**
* **Nodes:** `y₁, y₂, y₃, y₄, x₁, x₂, x₃, x₄, x₅`
* **Edge Labels:** `+`, `-`, `×`, `÷`
* **Label:** "iter" (appearing twice within orange boxes)
**Diagram (c): Chain-of-Thought can simulate node by node**
* **Nodes:** `x₁, x₂, x₃, x₄, x₅`, `y₁, y₂, y₃, y₄`
* **Edge Labels:** `step`, `+`, `×`, `÷`
### Detailed Analysis or Content Details
**Diagram (a): Computation Graph (DAG)**
The DAG consists of two layers of nodes. The bottom layer contains input nodes `x₁` through `x₅`. The top layer contains output nodes `y₁` through `y₄`. Edges connect the input nodes to intermediate nodes and ultimately to the output nodes.
* `x₁` connects to `+6` and then to `y₁`.
* `x₂` connects to `+9` and then to `y₂`.
* `x₃` connects to `+10` and then to `y₃`.
* `x₄` connects to `-11` and then to `y₄`.
* `x₅` connects to `×12` and then to `y₄`.
* `x₁` also connects to `×7` and then to `y₃`.
* `x₂` also connects to `×8` and then to `y₄`.
* The function set `Fₙ = {−, ×, ÷, +}` defines the operations performed within the graph.
* A box indicates a "size" of 12 and a "depth" of 2.
**Diagram (b): Latent Thought simulates layer-by-layer**
This diagram shows a layered structure similar to (a), but with operations directly labeled on the edges.
* `x₁` connects to `+` and then to `y₁`.
* `x₂` connects to `+` and then to `y₂`.
* `x₃` connects to `+` and then to `y₃`.
* `x₄` connects to `÷` and then to `y₄`.
* `x₅` connects to `×` and then to `y₄`.
* The "iter" label appears twice, suggesting iterative processing.
**Diagram (c): Chain-of-Thought can simulate node by node**
This diagram shows a more interconnected network.
* `x₁` connects to `step` and then to `y₁`.
* `x₂` connects to `step` and then to `y₂`.
* `x₃` connects to `step` and then to `y₃`.
* `x₄` connects to `step` and then to `y₄`.
* `x₅` connects to `+` and then to `y₁`.
* `y₁` connects to `+` and then to `y₂`.
* `y₂` connects to `÷` and then to `y₃`.
* `y₃` connects to `×` and then to `y₄`.
### Key Observations
* Diagram (a) represents a static computation graph, while (b) and (c) represent dynamic thought processes.
* Diagram (b) emphasizes layer-by-layer simulation, indicated by the "iter" label.
* Diagram (c) highlights a chain-of-thought approach, where each node's output becomes the input for the next.
* The operations used in each diagram differ, suggesting different computational strategies.
### Interpretation
The diagrams illustrate different approaches to modeling computation and thought. Diagram (a) represents a traditional computational graph, where operations are defined and executed in a fixed order. Diagrams (b) and (c) explore more flexible and dynamic approaches, simulating thought processes through iterative layers or chained reasoning. The "size" and "depth" parameters in diagram (a) likely refer to the complexity of the graph. The "iter" label in diagram (b) suggests an iterative refinement process, while the "step" label in diagram (c) indicates a sequential progression of thought. The differences in operations (e.g., `+`, `×`, `÷`, `-` vs. `step`) suggest that each approach is suited for different types of problems or cognitive tasks. The diagrams collectively demonstrate a progression from static computation to dynamic thought simulation, highlighting the potential for AI systems to mimic human reasoning processes.