TECHNICAL ASSET FINGERPRINT
31e8b4cbfcadfd969992838e
Click to view fullscreen
Press ESC or click to close
FOUND IN PAPERS
EXPERT: healer-alpha-free VERSION 1
RUNTIME: free/openrouter/healer-alpha
INTEL_VERIFIED
## Diagram: Computation Graph and Simulation Methods
### Overview
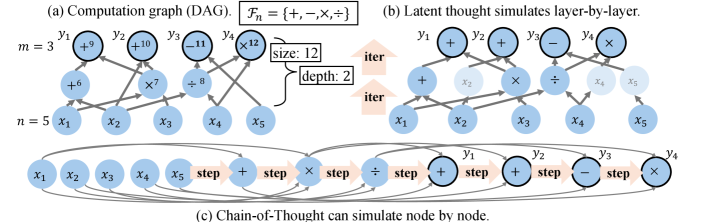
The image is a technical diagram composed of three interconnected parts labeled (a), (b), and (c). It illustrates different representations and simulation methods for a computational process, likely related to neural networks or symbolic reasoning. The diagram uses nodes (circles) representing variables or operations, connected by directed edges (arrows) to show data flow or dependencies.
### Components/Axes
The diagram is divided into three distinct panels:
**Panel (a): Computation graph (DAG)**
* **Title:** `(a) Computation graph (DAG)`
* **Set Notation:** `F_n = {+, -, ×, ÷}` (The set of available operations: addition, subtraction, multiplication, division).
* **Parameters:**
* `m = 3` (Number of output nodes, labeled `y1`, `y2`, `y3`).
* `n = 5` (Number of input nodes, labeled `x1`, `x2`, `x3`, `x4`, `x5`).
* `size: 12` (Total number of nodes in the graph).
* `depth: 2` (The maximum number of sequential operations from input to output).
* **Node Labels & Values:**
* **Input Layer (Bottom):** `x1`, `x2`, `x3`, `x4`, `x5`.
* **Hidden Layer (Middle):** Nodes containing operations and values: `+6`, `×2`, `÷8`.
* **Output Layer (Top):** `y1` (with value `+9`), `y2` (with value `+10`), `y3` (with value `-11`), `y4` (with value `÷12`). *Note: The label `y4` is present, but the parameter `m=3` suggests only `y1-y3` are primary outputs; `y4` may be an auxiliary or intermediate output.*
**Panel (b): Latent thought simulates layer-by-layer.**
* **Title:** `(b) Latent thought simulates layer-by-layer.`
* **Structure:** Shows an iterative process (`iter` arrows pointing upwards) simulating the computation graph from (a) in two layers.
* **Iteration 1 (Bottom):** Shows the first layer of computation. Active nodes (solid blue) are `x1`, `x2`, `x3`, `x4`, `x5` and operation nodes `+`, `×`, `÷`. Inactive/latent nodes (faded blue) are `x2`, `x4`, `x5` in the operation layer and `y1`, `y2`, `y3`, `y4` in the output layer.
* **Iteration 2 (Top):** Shows the second layer. Active nodes are now the output nodes `y1`, `y2`, `y3`, `y4` with their operations (`+`, `+`, `-`, `×`). The previous operation nodes are now faded.
**Panel (c): Chain-of-Thought can simulate node by node.**
* **Title:** `(c) Chain-of-Thought can simulate node by node.`
* **Structure:** A linear sequence of steps, enclosed in an oval, representing a step-by-step execution.
* **Sequence:** `x1` → `x2` → `x3` → `x4` → `x5` → `step` → `+` → `step` → `×` → `step` → `÷` → `step` → `y1` → `step` → `y2` → `step` → `y3` → `step` → `y4`.
* **Visual Emphasis:** The nodes `y1`, `y2`, `y3`, `y4` have a darker, thicker border compared to the input and operation nodes.
### Detailed Analysis
**Panel (a) - Graph Topology:**
* **Input to Hidden Connections:**
* `x1`, `x2` → `+6` node.
* `x2`, `x3` → `×2` node.
* `x3`, `x4`, `x5` → `÷8` node.
* **Hidden to Output Connections:**
* `+6` node → `y1 (+9)` and `y2 (+10)`.
* `×2` node → `y2 (+10)` and `y3 (-11)`.
* `÷8` node → `y3 (-11)` and `y4 (÷12)`.
* **Trend/Flow:** The graph shows a feed-forward flow from inputs (`x`) through a single hidden layer of operations to produce outputs (`y`). Each output is a function of multiple hidden nodes, and each hidden node feeds multiple outputs, creating a densely connected bipartite structure between layers.
**Panel (b) - Layer-wise Simulation:**
* **Trend:** The simulation progresses from the bottom layer (inputs and first operations) to the top layer (final outputs). The "iter" arrows indicate a clear bottom-up, layer-by-layer activation sequence, mimicking the forward pass of a neural network.
**Panel (c) - Sequential Simulation:**
* **Trend:** The simulation follows a strict left-to-right, sequential order. It first processes all inputs (`x1` to `x5`), then all operations (`+`, `×`, `÷`), and finally all outputs (`y1` to `y4`). This represents a token-by-token or step-by-step generation process, akin to a Chain-of-Thought reasoning trace.
### Key Observations
1. **Discrepancy in Output Count:** Panel (a) defines `m=3` (outputs `y1, y2, y3`) but clearly draws and labels a fourth output node, `y4`. This suggests `y4` might be an extra or auxiliary output not counted in the primary parameter `m`.
2. **Operation Set vs. Usage:** The defined operation set `F_n` includes subtraction (`-`), which is used in node `y3 (-11)`. However, the hidden layer only uses `+`, `×`, and `÷`. Subtraction appears only at the output stage.
3. **Simulation Paradigms:** The diagram contrasts two distinct simulation methods: (b) parallel/layer-wise (like a standard neural network forward pass) and (c) sequential/node-by-node (like an autoregressive language model generating a reasoning chain).
4. **Visual Coding:** Solid blue circles represent active or computed nodes in the current step of simulation (in b and c). Faded blue circles represent latent, inactive, or previously computed nodes. Nodes with darker borders in (c) highlight the final output sequence.
### Interpretation
This diagram serves as a conceptual bridge between **symbolic computation graphs** and **modern neural network inference paradigms**.
* **What it demonstrates:** It shows how a fixed, structured computation (the DAG in part a) can be executed or "simulated" by different underlying mechanisms. Panel (b) represents a **parallel, layer-parallel** execution model, efficient for hardware like GPUs. Panel (c) represents a **sequential, autoregressive** execution model, characteristic of large language models (LLMs) that generate outputs token-by-token.
* **Relationship between elements:** The computation graph (a) is the ground-truth specification of *what* needs to be computed. Panels (b) and (c) are two different *how* strategies for realizing that computation. The "latent thought" in (b) implies hidden states being updated in layers, while "Chain-of-Thought" in (c) implies an explicit, interpretable sequence of steps.
* **Notable Implication:** The core message is that a **Chain-of-Thought (CoT) process can emulate the execution of a complex, pre-defined computational graph**. This is a foundational idea for research into making LLMs perform reliable, multi-step reasoning by having them generate a step-by-step "program" (the sequence in c) that mirrors the structure of a formal computation (the graph in a). The discrepancy with `y4` might be an intentional minor error to test attention to detail or could indicate the graph supports optional outputs.
DECODING INTELLIGENCE...