\n
## Line Chart: EGA vs. Environment Step
### Overview
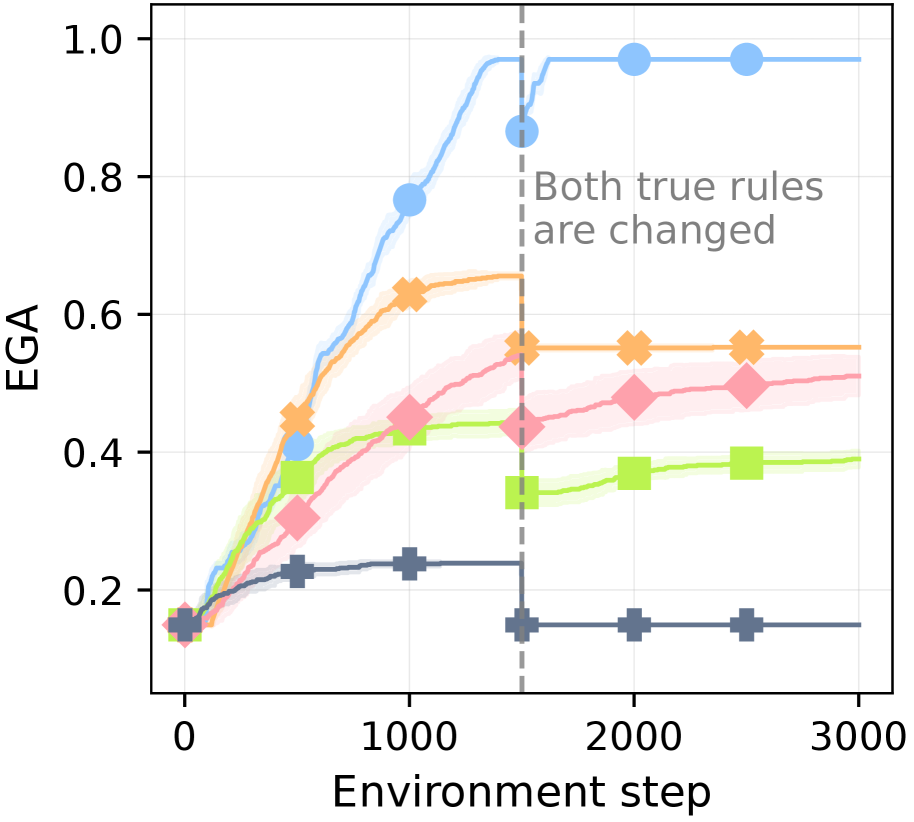
This image presents a line chart illustrating the relationship between "EGA" (Evolutionary Game Algorithm) and "Environment step". The chart displays multiple lines representing different experimental conditions or algorithms, tracking how EGA changes over time (measured in environment steps). A vertical dashed line indicates a point where a change was made to the "true rules" governing the environment.
### Components/Axes
* **X-axis:** "Environment step", ranging from 0 to approximately 3000. The axis is linearly scaled.
* **Y-axis:** "EGA", ranging from 0 to 1.0. The axis is linearly scaled.
* **Lines:** Six distinct lines, each with a unique color:
* Blue
* Orange
* Green
* Red
* Pink
* Gray
* **Vertical Dashed Line:** Located at approximately Environment step 1750, with the text "Both true rules are changed" positioned to the right.
* **Grid:** A light gray grid is present, aiding in the readability of the data points.
### Detailed Analysis
Let's analyze each line's trend and extract approximate data points.
* **Blue Line:** This line shows a rapid increase in EGA from approximately 0.1 at Environment step 0 to nearly 1.0 by Environment step 1000. It plateaus around 0.95-1.0 for the remainder of the chart.
* **Orange Line:** This line starts at approximately 0.15 at Environment step 0 and increases steadily to around 0.6 by Environment step 1000. It continues to increase, but at a slower rate, reaching approximately 0.7 by Environment step 3000.
* **Green Line:** This line begins at approximately 0.1 at Environment step 0 and increases to around 0.4 by Environment step 1000. It continues to increase, reaching approximately 0.5 by Environment step 3000.
* **Red Line:** This line starts at approximately 0.15 at Environment step 0 and increases to around 0.5 by Environment step 1000. It plateaus around 0.55-0.6 for the remainder of the chart.
* **Pink Line:** This line begins at approximately 0.2 at Environment step 0 and increases to around 0.5 by Environment step 1000. It continues to increase, reaching approximately 0.6 by Environment step 3000.
* **Gray Line:** This line starts at approximately 0.18 at Environment step 0 and remains relatively flat, fluctuating between 0.15 and 0.2 throughout the entire chart.
### Key Observations
* The blue line demonstrates the fastest and most significant increase in EGA, reaching a plateau at a high value.
* The gray line remains consistently low and relatively unchanged, indicating a lack of significant evolution or adaptation.
* The vertical dashed line at Environment step 1750 appears to coincide with a slight dip in the blue line, but it doesn't significantly affect the other lines.
* The orange, green, red, and pink lines show similar, but distinct, growth patterns, suggesting different rates of adaptation or learning.
### Interpretation
The chart likely represents the performance of different algorithms or strategies in an evolving environment. The "EGA" metric could represent a measure of success, adaptation, or fitness. The "Environment step" represents the progression of time or the number of interactions within the environment.
The rapid increase in the blue line suggests that the corresponding algorithm quickly learned to exploit the environment. The plateau indicates that it reached a point of optimal performance. The gray line's stagnation suggests that the corresponding algorithm failed to adapt or was poorly suited to the environment.
The change in "true rules" at Environment step 1750 may have disrupted the environment, causing a temporary dip in the blue line's performance as it readjusted. The fact that the other lines were less affected suggests that the blue line's strategy was particularly sensitive to the rule change.
The differences between the orange, green, red, and pink lines suggest that different algorithms have varying levels of adaptability and efficiency. Further analysis would be needed to determine the specific characteristics of each algorithm and the reasons for their performance differences. The data suggests that the environment is dynamic and that algorithms must be able to adapt to changing conditions to maintain high performance.