## Line Graph: Evolution of EGA Over Environment Steps
### Overview
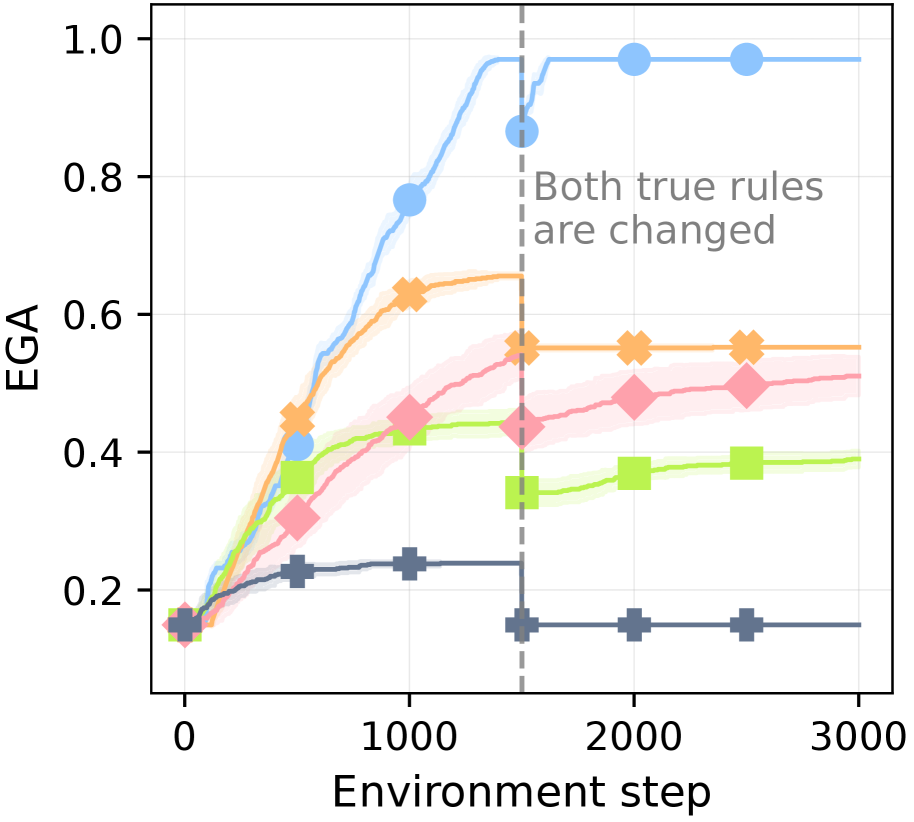
The graph depicts the evolution of Expected Generalization Accuracy (EGA) across four distinct algorithms or strategies over 3000 environment steps. A vertical dashed line at ~1500 steps marks a critical event labeled "Both true rules are changed." Four colored lines with shaded confidence intervals represent different approaches, each with unique performance trajectories.
### Components/Axes
- **X-axis**: "Environment step" (0 to 3000, linear scale)
- **Y-axis**: "EGA" (0.0 to 1.0, linear scale)
- **Legend**:
- Blue circles (top line)
- Orange diamonds (second line)
- Pink diamonds (third line)
- Green squares (bottom line)
- **Key annotation**: Vertical dashed line at ~1500 steps with label "Both true rules are changed"
### Detailed Analysis
1. **Blue Circles (Top Line)**:
- Starts at ~0.15 EGA at step 0
- Sharp upward trend to ~0.8 EGA by step 1000
- Plateaus at ~0.95 EGA after step 1500
- Shaded region indicates ±0.05 uncertainty
2. **Orange Diamonds (Second Line)**:
- Begins at ~0.4 EGA at step 0
- Gradual increase to ~0.6 EGA by step 1500
- Stabilizes at ~0.55 EGA post-rule change
- Shaded region ±0.03
3. **Pink Diamonds (Third Line)**:
- Initial value ~0.3 EGA at step 0
- Steady rise to ~0.5 EGA by step 1500
- Plateaus at ~0.48 EGA after rule change
- Shaded region ±0.02
4. **Green Squares (Bottom Line)**:
- Starts at ~0.2 EGA at step 0
- Slow increase to ~0.4 EGA by step 1500
- Stabilizes at ~0.38 EGA post-rule change
- Shaded region ±0.01
### Key Observations
- **Post-rule change plateau**: All lines flatten after step 1500, suggesting adaptation to new rules
- **Performance hierarchy**: Blue > Orange > Pink > Green in final EGA values
- **Divergent trajectories**: Blue line shows fastest improvement pre-rule change
- **Uncertainty patterns**: Shaded regions narrow as steps increase, indicating stabilizing measurements
### Interpretation
The data demonstrates that all tested strategies eventually stabilize their EGA after the rule change event, but with varying efficiency:
1. **Blue algorithm** achieves highest performance (0.95 EGA) and fastest adaptation, suggesting optimal rule exploitation
2. **Orange and pink lines** show moderate adaptation, with orange maintaining higher EGA than pink despite similar trajectories
3. **Green squares** represent the least effective strategy, with slowest improvement and lowest final EGA
4. The shaded confidence intervals imply measurement variability decreases with experience, supporting the reliability of plateau values
The abrupt change in slope at step 1500 correlates with the rule modification event, indicating this was a pivotal moment in the environment's dynamics. The persistent performance gaps between strategies suggest inherent differences in their ability to generalize to new rule sets.