\n
## Line Chart: Algorithm Performance Comparison
### Overview
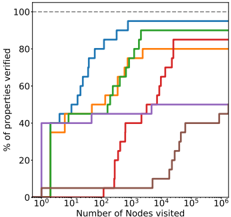
The image displays a line chart comparing the performance of six different algorithms or methods in verifying properties as a function of the number of nodes visited. The chart uses a logarithmic scale for the x-axis and a linear scale for the y-axis. The primary message is the trade-off between computational effort (nodes visited) and verification success rate.
### Components/Axes
* **Chart Type:** Multi-line chart with step-like progression.
* **X-Axis (Bottom):**
* **Label:** "Number of Nodes visited"
* **Scale:** Logarithmic (base 10).
* **Markers/Ticks:** 10⁰ (1), 10¹ (10), 10² (100), 10³ (1,000), 10⁴ (10,000), 10⁵ (100,000), 10⁶ (1,000,000).
* **Y-Axis (Left):**
* **Label:** "% of properties verified"
* **Scale:** Linear, from 0 to 100.
* **Markers/Ticks:** 0, 20, 40, 60, 80, 100.
* **Legend (Top-Left Corner):** Contains six entries, each with a colored line segment and a text label.
1. **Blue Line:** "BFS"
2. **Green Line:** "DFS"
3. **Orange Line:** "Random"
4. **Red Line:** "Heuristic"
5. **Purple Line:** "SAT"
6. **Brown Line:** "SAT+Heuristic"
* **Grid:** A faint, dashed horizontal grid line is visible at the 100% mark.
### Detailed Analysis
**Trend Verification & Data Point Extraction (Approximate):**
1. **BFS (Blue Line):**
* **Trend:** Starts at a high verification percentage with very few nodes visited, rises steeply, and plateaus early.
* **Points:** At ~1 node visited, ~40% verified. Reaches ~90% by ~100 nodes. Plateaus at ~95% from ~1,000 nodes onward.
2. **DFS (Green Line):**
* **Trend:** Starts lower than BFS, rises very steeply between 10 and 100 nodes, and plateaus at a similar high level.
* **Points:** At ~10 nodes, ~20% verified. Surges to ~90% by ~200 nodes. Plateaus at ~95% from ~1,000 nodes onward, closely matching BFS.
3. **Random (Orange Line):**
* **Trend:** Shows a steady, gradual increase across the entire range of nodes visited.
* **Points:** At ~10 nodes, ~10% verified. At ~1,000 nodes, ~70% verified. At ~100,000 nodes, ~80% verified. Appears to still be slowly increasing at 1,000,000 nodes.
4. **Heuristic (Red Line):**
* **Trend:** Begins its ascent later than BFS/DFS/Random but rises very sharply once it starts.
* **Points:** Remains near 0% until ~1,000 nodes. Jumps to ~40% by ~5,000 nodes. Reaches ~85% by ~100,000 nodes and plateaus.
5. **SAT (Purple Line):**
* **Trend:** A flat, horizontal line indicating no change in performance with increased nodes visited.
* **Points:** Constant at 50% verification across the entire x-axis (from 1 to 1,000,000 nodes).
6. **SAT+Heuristic (Brown Line):**
* **Trend:** The slowest to start, remaining near 0% for the longest duration, but then exhibits the steepest final ascent.
* **Points:** Remains near 0% until ~10,000 nodes. Rises sharply to ~40% by ~100,000 nodes. Reaches ~75% by ~1,000,000 nodes and appears to still be climbing.
### Key Observations
* **Performance Clustering:** BFS and DFS form a high-performance cluster, achieving near-maximum verification (~95%) with relatively low computational cost (~1,000 nodes).
* **The SAT Baseline:** The "SAT" method provides a fixed 50% success rate, acting as a baseline. It is unaffected by the number of nodes visited.
* **Late-Stage Power:** The "Heuristic" and "SAT+Heuristic" methods require a significant initial investment in nodes visited (10³-10⁴) before showing any results, but then improve rapidly.
* **Efficiency Gradient:** From most to least efficient in the early stage (10² nodes): BFS > DFS > Random > Heuristic ≈ SAT+Heuristic > SAT.
* **Ultimate Potential:** At the far right of the chart (10⁶ nodes), BFS, DFS, and Heuristic converge near 85-95%, while Random is around 80%, SAT+Heuristic is climbing past 75%, and SAT remains at 50%.
### Interpretation
This chart likely compares search or verification strategies for a computational problem, such as model checking, property testing, or state-space exploration. The data suggests:
1. **Strategy Matters Profoundly:** The choice of algorithm (BFS, DFS, Random, etc.) has a dramatic impact on both the speed of verification and the ultimate success rate.
2. **The Cost of Completeness:** Methods like SAT (Satisfiability Solving) may guarantee finding a solution if one exists within their search space, but this chart shows they can be inefficient for *partial* verification, stuck at 50%. Combining SAT with a heuristic ("SAT+Heuristic") aims to overcome this, but requires a large upfront cost.
3. **Diminishing Returns:** For the top-performing methods (BFS, DFS), investing more than ~1,000 nodes yields minimal improvement, suggesting the property verification problem has a "hard" core that is solved quickly, with a long tail of difficult cases.
4. **The Role of Randomness:** The "Random" strategy's steady climb indicates that a brute-force, non-guided approach is viable given enough resources, but it is consistently outperformed by guided strategies (BFS, DFS, Heuristic) at any given budget of nodes visited.
In essence, the chart is a visual argument for using intelligent, guided search strategies (like BFS/DFS) over purely random or purely logical (SAT) approaches when the goal is to quickly verify a high percentage of properties in a large system.