# Technical Document Extraction: Probability Density Graph
## Image Type
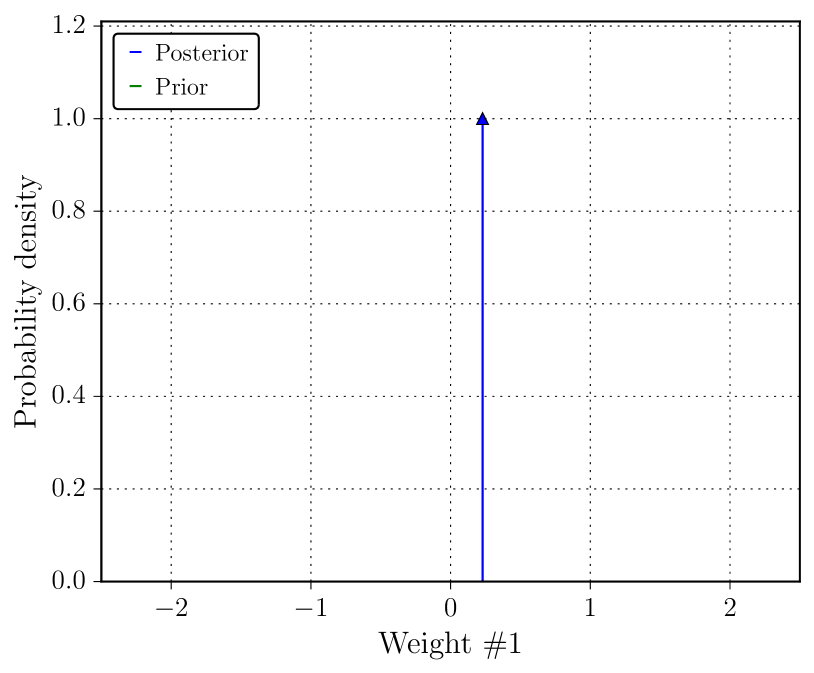
Line graph depicting probability density distributions for "Posterior" and "Prior" data series.
## Labels and Axis Titles
- **X-axis**: "Weight #1" with numerical markers at [-2, -1, 0, 1, 2].
- **Y-axis**: "Probability density" with markers at [0.0, 0.2, 0.4, 0.6, 0.8, 1.0, 1.2].
- **Legend**: Located in the top-left corner, labeled with:
- Blue line: "Posterior"
- Green line: "Prior"
## Data Series and Trends
1. **Posterior (Blue Line)**:
- **Trend**: Vertical spike at x = 0, reaching a maximum probability density of 1.0.
- **Key Data Point**: [x=0, y=1.0] (peak value).
- **Behavior**: No visible density outside x = 0; all other x-values show zero probability density.
2. **Prior (Green Line)**:
- **Visibility**: No visible line or data points in the graph.
- **Inference**: Likely absent or has zero probability density across all x-values.
## Legend Placement and Validation
- **Spatial Grounding**: Legend positioned at the top-left corner of the plot area.
- **Color Validation**:
- Blue line matches "Posterior" label.
- Green line label ("Prior") has no corresponding visible data, suggesting either missing data or a density of zero.
## Component Isolation
1. **Header**: Contains the legend box with labels for "Posterior" (blue) and "Prior" (green).
2. **Main Chart**:
- X-axis spans [-2, 2] with uniform intervals.
- Y-axis spans [0, 1.2] with linear scaling.
- Blue vertical line dominates the plot at x = 0.
3. **Footer**: No additional text or annotations present.
## Missing Elements
- No data tables, heatmaps, or embedded text blocks detected.
- No secondary axes, annotations, or gridlines beyond the dotted grid structure.
## Conclusion
The graph exclusively represents a posterior probability density distribution concentrated at x = 0, with no observable prior distribution. The absence of the green "Prior" line suggests either a lack of data or a density of zero across the plotted range.