## Scatter Plot Matrix: Error vs Causal Effect (ATE) Across Different Methods
### Overview
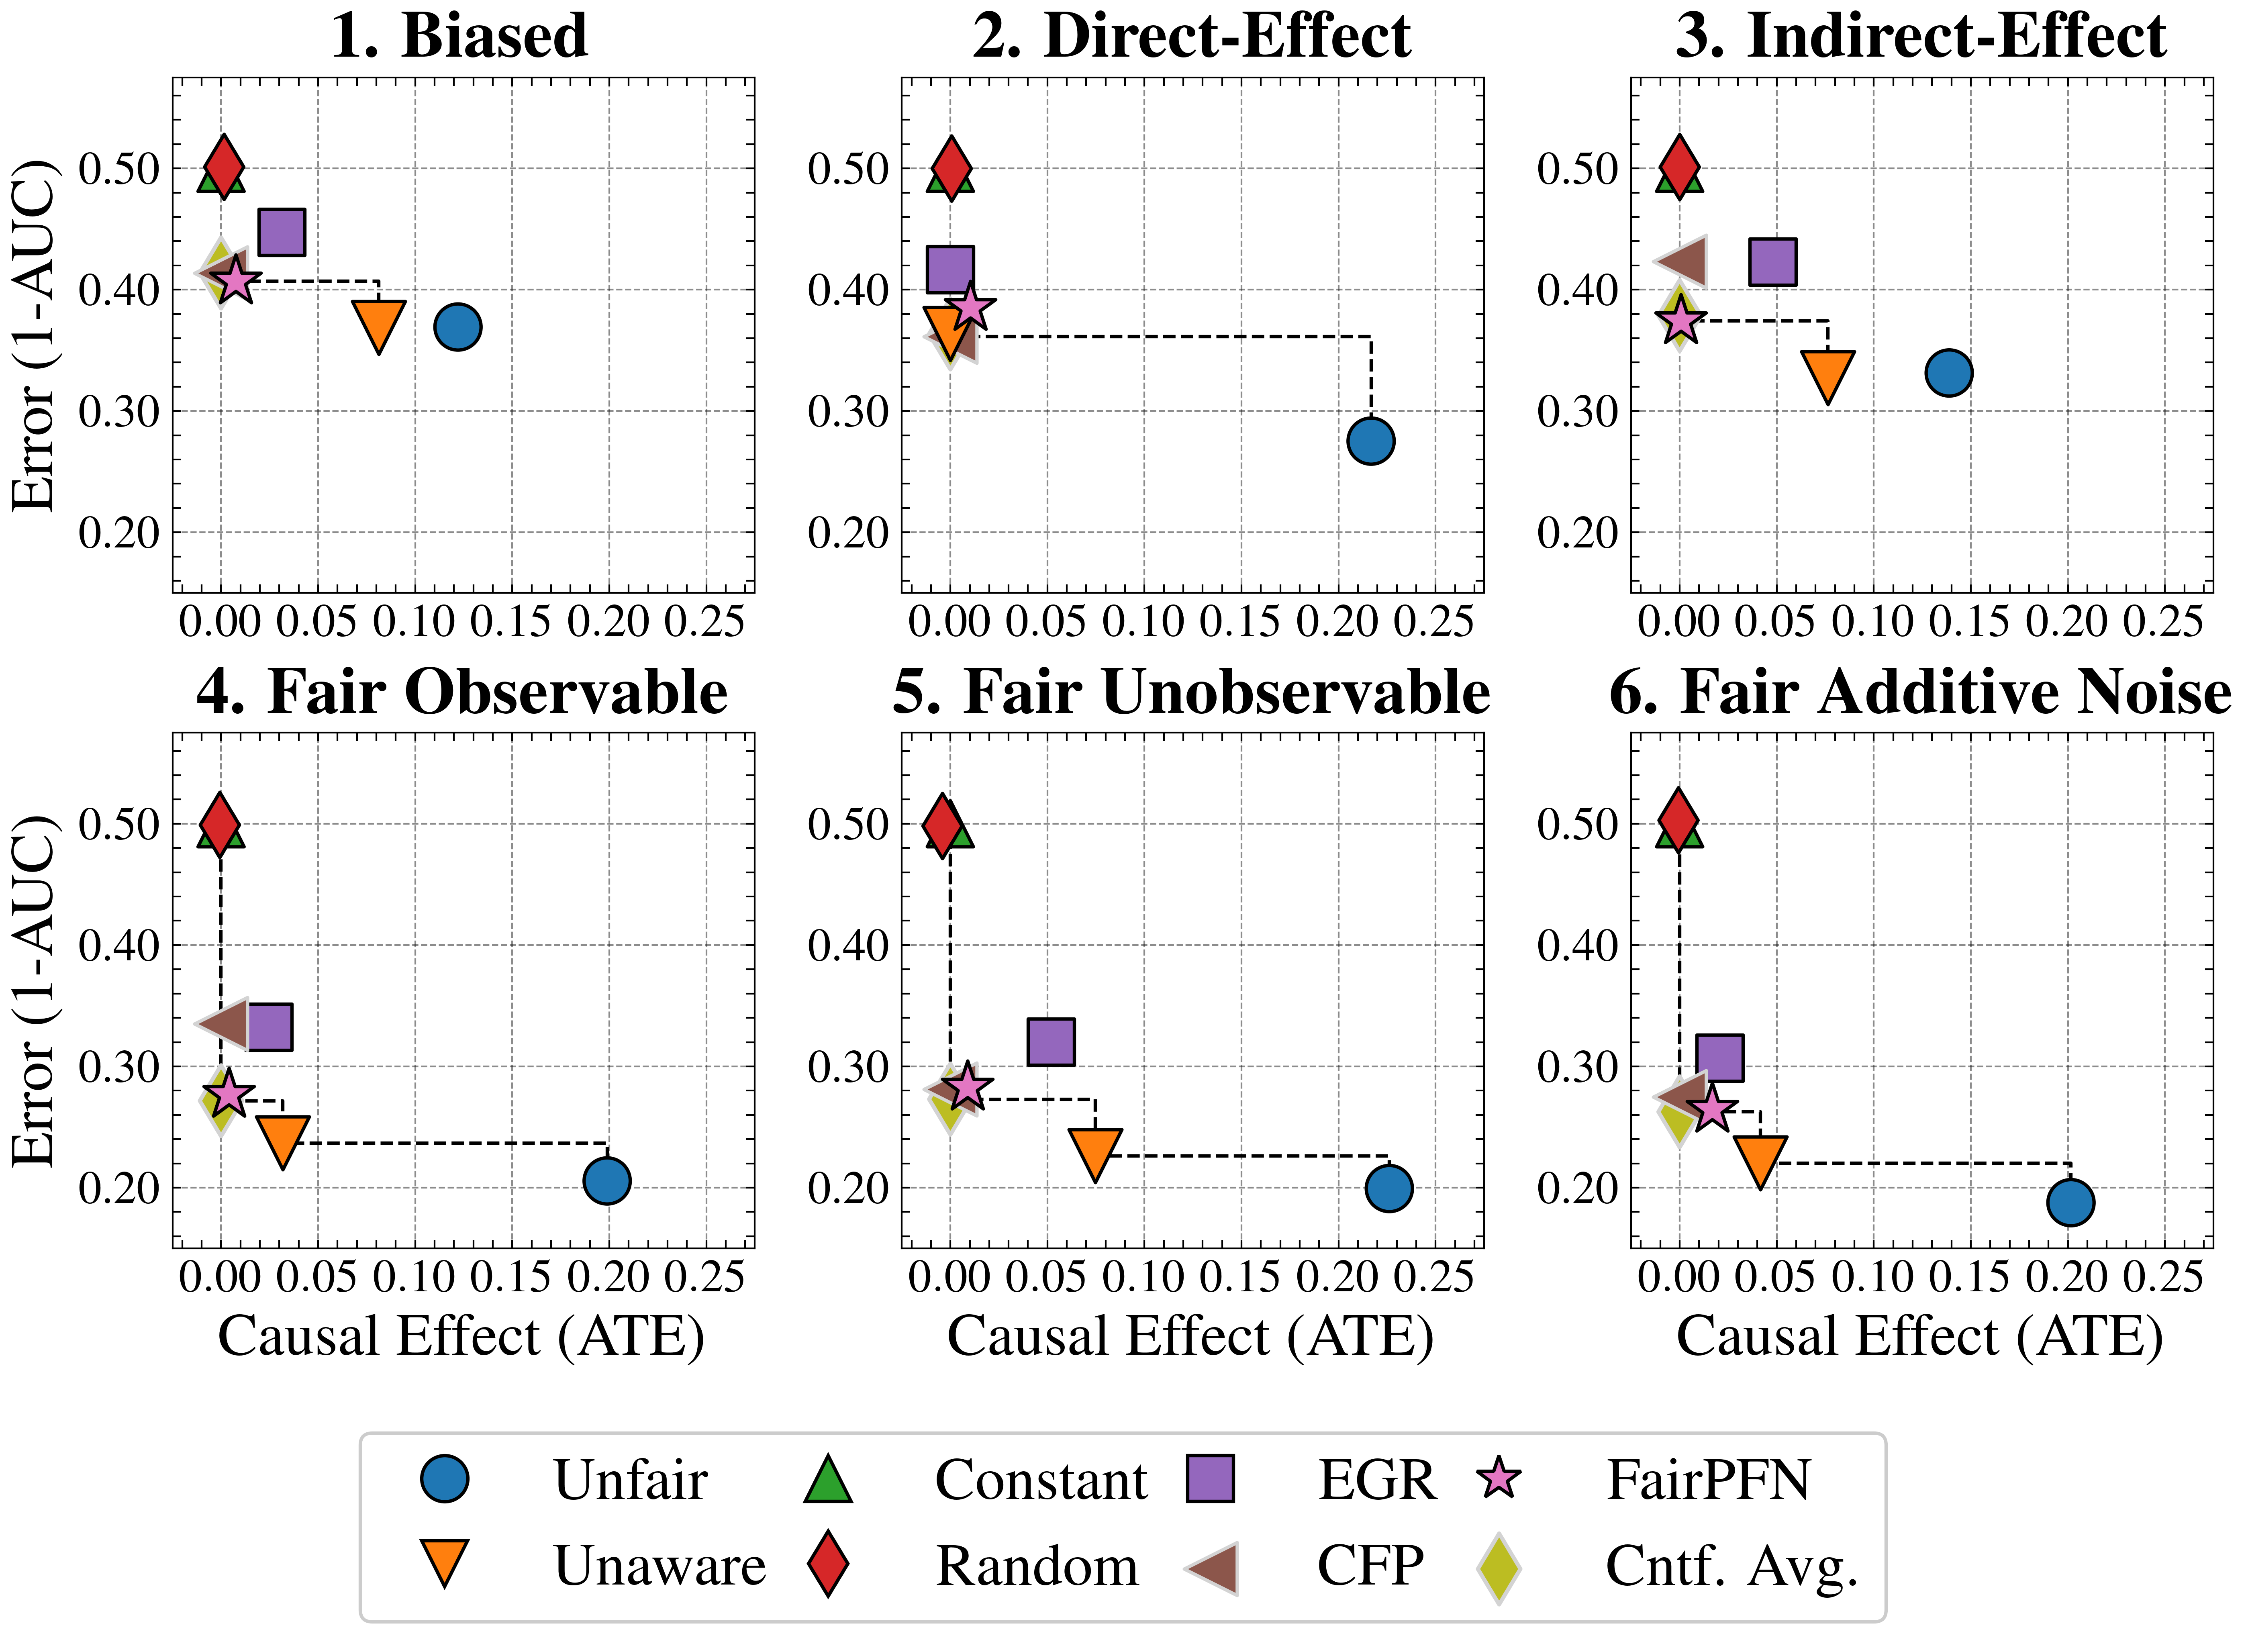
The image contains six scatter plots arranged in a 2x3 grid, each comparing error rates (1-AUC) against causal effect magnitudes (ATE) for different fairness/intervention methods. Each plot uses distinct geometric markers and colors to represent specific algorithms or fairness criteria.
### Components/Axes
**Axes:**
- X-axis: "Causal Effect (ATE)" (0.00–0.25 in 0.05 increments)
- Y-axis: "Error (1-AUC)" (0.20–0.50 in 0.05 increments)
- All subplots share identical axis scales
**Legend (bottom center):**
1. Blue circle: Unfair
2. Green triangle: Constant
3. Purple square: EGR
4. Pink star: FairPFN
5. Orange triangle: Unaware
6. Red diamond: Random
7. Brown triangle: CFP
8. Yellow diamond: Cntf. Avg.
**Subplot Titles:**
1. Biased
2. Direct-Effect
3. Indirect-Effect
4. Fair Observable
5. Fair Unobservable
6. Fair Additive Noise
### Detailed Analysis
**1. Biased**
- Red diamond (Random): (0.05, 0.50)
- Green triangle (Constant): (0.00, 0.45)
- Purple square (EGR): (0.10, 0.40)
- Brown triangle (CFP): (0.02, 0.38)
- Yellow diamond (Cntf. Avg.): (0.03, 0.35)
- Pink star (FairPFN): (0.04, 0.32)
- Blue circle (Unfair): (0.20, 0.30)
**2. Direct-Effect**
- Red diamond (Random): (0.05, 0.48)
- Green triangle (Constant): (0.00, 0.42)
- Purple square (EGR): (0.10, 0.38)
- Brown triangle (CFP): (0.02, 0.35)
- Yellow diamond (Cntf. Avg.): (0.03, 0.32)
- Pink star (FairPFN): (0.04, 0.30)
- Blue circle (Unfair): (0.20, 0.28)
**3. Indirect-Effect**
- Red diamond (Random): (0.05, 0.45)
- Green triangle (Constant): (0.00, 0.40)
- Purple square (EGR): (0.10, 0.35)
- Brown triangle (CFP): (0.02, 0.33)
- Yellow diamond (Cntf. Avg.): (0.03, 0.30)
- Pink star (FairPFN): (0.04, 0.28)
- Blue circle (Unfair): (0.20, 0.25)
**4. Fair Observable**
- Red diamond (Random): (0.05, 0.48)
- Green triangle (Constant): (0.00, 0.42)
- Purple square (EGR): (0.10, 0.38)
- Brown triangle (CFP): (0.02, 0.35)
- Yellow diamond (Cntf. Avg.): (0.03, 0.32)
- Pink star (FairPFN): (0.04, 0.30)
- Blue circle (Unfair): (0.20, 0.28)
**5. Fair Unobservable**
- Red diamond (Random): (0.05, 0.45)
- Green triangle (Constant): (0.00, 0.40)
- Purple square (EGR): (0.10, 0.35)
- Brown triangle (CFP): (0.02, 0.33)
- Yellow diamond (Cntf. Avg.): (0.03, 0.30)
- Pink star (FairPFN): (0.04, 0.28)
- Blue circle (Unfair): (0.20, 0.25)
**6. Fair Additive Noise**
- Red diamond (Random): (0.05, 0.45)
- Green triangle (Constant): (0.00, 0.40)
- Purple square (EGR): (0.10, 0.35)
- Brown triangle (CFP): (0.02, 0.33)
- Yellow diamond (Cntf. Avg.): (0.03, 0.30)
- Pink star (FairPFN): (0.04, 0.28)
- Blue circle (Unfair): (0.20, 0.25)
### Key Observations
1. **FairPFN (pink star)** consistently shows the lowest error rates across all scenarios
2. **Unfair (blue circle)** demonstrates unexpectedly low error in "Fair Additive Noise" scenario
3. **Random (red diamond)** consistently exhibits highest error rates
4. **Cntf. Avg. (yellow diamond)** shows moderate performance across all scenarios
5. Error rates decrease with increasing ATE in most scenarios
### Interpretation
The data suggests that:
- FairPFN algorithm demonstrates superior performance across all causal effect scenarios
- The Unfair method's performance varies significantly by scenario, particularly excelling in additive noise conditions
- Random method consistently underperforms, indicating potential fundamental limitations
- Causal effect magnitude (ATE) generally correlates with reduced error rates, except in the Biased scenario where higher ATE doesn't improve performance for some methods
- The grid layout reveals methodological consistency across different fairness criteria, with similar performance patterns emerging in observable vs unobservable scenarios
The visualization emphasizes the importance of method selection based on specific causal effect characteristics and fairness requirements.