\n
## Block Diagram: Pitch Control System
### Overview
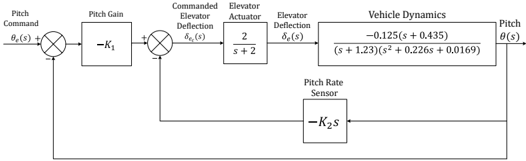
The image depicts a block diagram representing a pitch control system for a vehicle. It illustrates the flow of signals from a pitch command through various components – gain, actuator, vehicle dynamics, and feedback – to ultimately control the pitch angle. The diagram uses standard block diagram notation to represent mathematical relationships and signal flow.
### Components/Axes
The diagram consists of the following components:
* **Pitch Command:** Input signal denoted as θ<sub>d</sub>(s).
* **Pitch Gain:** Block labeled -K<sub>1</sub>.
* **Summing Junctions:** Represented by circles with "+" and "-" signs, indicating addition and subtraction of signals.
* **Commanded Elevator Deflection:** Signal denoted as δ<sub>c</sub>(s).
* **Elevator Actuator:** Block with transfer function 2/(s+2).
* **Elevator Deflection:** Signal denoted as δ<sub>e</sub>(s).
* **Vehicle Dynamics:** Block with transfer function -0.125(s+0.435) / ((s+1.23)(s<sup>2</sup>+0.226s+0.0169)).
* **Pitch:** Output signal denoted as θ(s).
* **Pitch Rate Sensor:** Block labeled -K<sub>2</sub>s.
* **Feedback Loop:** A line connecting the pitch output θ(s) to a summing junction, representing feedback.
### Detailed Analysis
The system operates as follows:
1. **Pitch Command:** The system receives a desired pitch angle command, θ<sub>d</sub>(s).
2. **Pitch Gain:** This command is multiplied by a gain -K<sub>1</sub>.
3. **Commanded Elevator Deflection:** The output of the pitch gain is added to the feedback signal (from the pitch rate sensor) at a summing junction to produce the commanded elevator deflection, δ<sub>c</sub>(s).
4. **Elevator Actuator:** The commanded elevator deflection signal is passed through an elevator actuator with a transfer function of 2/(s+2), resulting in the actual elevator deflection, δ<sub>e</sub>(s).
5. **Vehicle Dynamics:** The elevator deflection affects the vehicle dynamics, modeled by the transfer function -0.125(s+0.435) / ((s+1.23)(s<sup>2</sup>+0.226s+0.0169)), producing the pitch angle output, θ(s).
6. **Pitch Rate Sensor:** The pitch angle is measured by a pitch rate sensor, which outputs a signal proportional to the pitch rate, -K<sub>2</sub>s.
7. **Feedback:** This signal is fed back to the summing junction, completing the control loop.
The transfer functions are:
* Pitch Gain: -K<sub>1</sub>
* Elevator Actuator: 2/(s+2)
* Vehicle Dynamics: -0.125(s+0.435) / ((s+1.23)(s<sup>2</sup>+0.226s+0.0169))
* Pitch Rate Sensor: -K<sub>2</sub>s
### Key Observations
The system employs a closed-loop control scheme with negative feedback. The negative signs in the gains (-K<sub>1</sub> and -K<sub>2</sub>) and the vehicle dynamics transfer function indicate that the system is designed to counteract disturbances and maintain the desired pitch angle. The actuator has a first-order response (2/(s+2)), while the vehicle dynamics are modeled as a more complex third-order system.
### Interpretation
This block diagram represents a simplified model of a pitch control system, commonly found in aircraft or other vehicles with pitch control surfaces. The negative feedback loop is crucial for stability and accurate tracking of the desired pitch angle. The gains K<sub>1</sub> and K<sub>2</sub> are tuning parameters that can be adjusted to optimize the system's performance (e.g., response time, overshoot, stability). The transfer functions represent the dynamic behavior of the individual components. The complexity of the vehicle dynamics transfer function suggests that the vehicle's response to elevator deflection is not simple and may involve multiple modes of oscillation or damping. The diagram provides a high-level overview of the system's structure and allows for analysis of its stability and performance characteristics using control theory techniques.