## Line Charts: Performance Metrics vs. Noise Ratio
### Overview
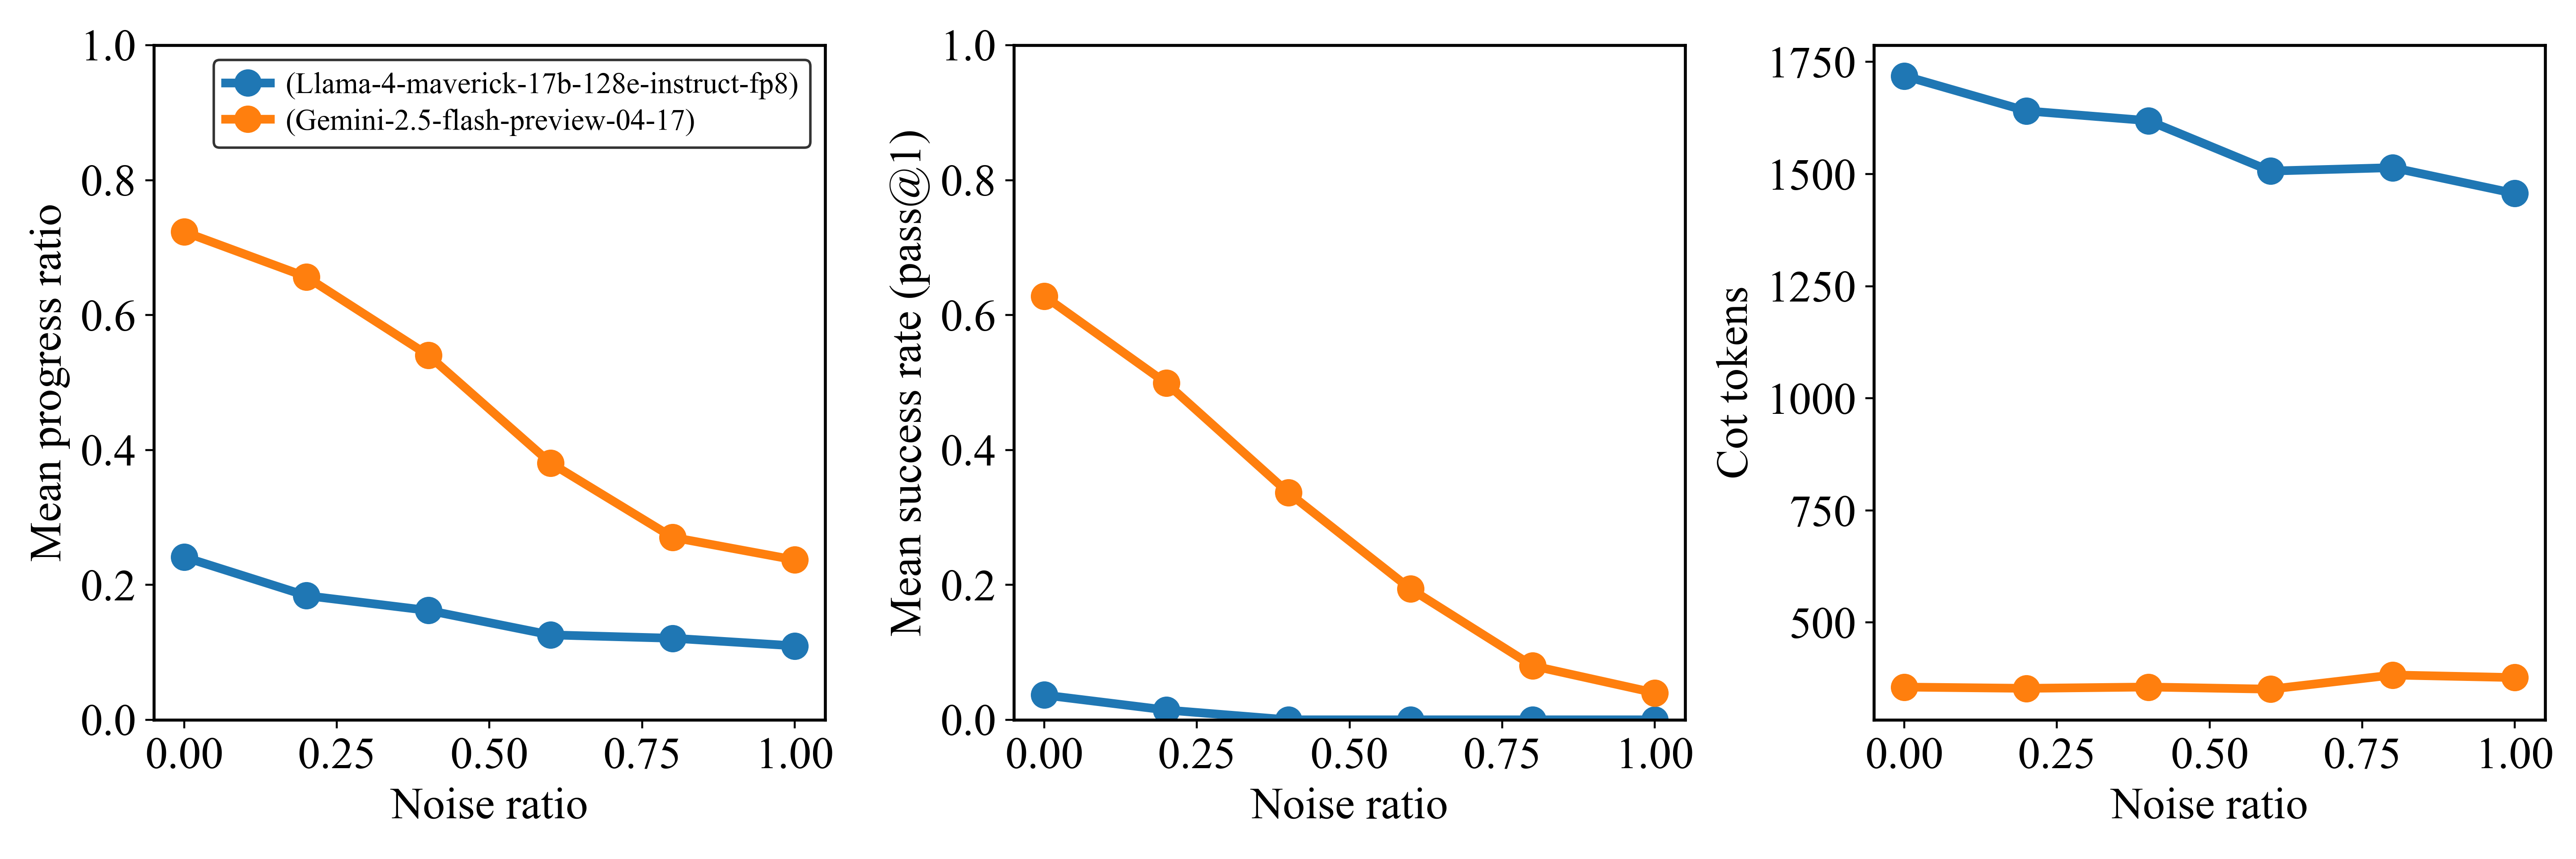
This image displays three side-by-side line charts illustrating the performance and token usage of two AI models—**Llama-4-maverick-17b-128e-instruct-fp8** (represented by the blue line) and **Gemini-2.5-flash-preview-04-17** (represented by the orange line)—across varying levels of "Noise ratio" (from 0.00 to 1.00). The charts measure "Mean progress ratio," "Mean success rate (pass@1)," and "Cot tokens" respectively.
### Components/Axes
* **Legend:** Located in the top-left corner of the first chart.
* Blue circle marker: (Llama-4-maverick-17b-128e-instruct-fp8)
* Orange circle marker: (Gemini-2.5-flash-preview-04-17)
* **X-Axis (Common to all three charts):** Labeled "Noise ratio," with a scale from 0.00 to 1.00, marked at 0.00, 0.25, 0.50, 0.75, and 1.00.
* **Y-Axes:**
* **Left Chart:** "Mean progress ratio" (Scale: 0.0 to 1.0).
* **Center Chart:** "Mean success rate (pass@1)" (Scale: 0.0 to 1.0).
* **Right Chart:** "Cot tokens" (Scale: 500 to 1750).
---
### Detailed Analysis
#### 1. Mean Progress Ratio (Left Chart)
* **Trend:** Both models exhibit a downward trend as the noise ratio increases.
* **Data Points (Approximate):**
* **Blue (Llama):** Starts at ~0.24 (0.00 noise), declines steadily to ~0.18 (0.25 noise), ~0.16 (0.50 noise), ~0.13 (0.75 noise), and ends at ~0.11 (1.00 noise).
* **Orange (Gemini):** Starts at ~0.72 (0.00 noise), declines to ~0.66 (0.25 noise), ~0.54 (0.50 noise), ~0.38 (0.75 noise), and ends at ~0.24 (1.00 noise).
#### 2. Mean Success Rate (pass@1) (Center Chart)
* **Trend:** Both models show a significant downward trend. The blue line (Llama) drops to near-zero very quickly.
* **Data Points (Approximate):**
* **Blue (Llama):** Starts at ~0.04 (0.00 noise), drops to ~0.02 (0.25 noise), and effectively hits 0.00 from 0.50 noise onwards.
* **Orange (Gemini):** Starts at ~0.63 (0.00 noise), drops to ~0.50 (0.25 noise), ~0.34 (0.50 noise), ~0.20 (0.75 noise), and ends at ~0.04 (1.00 noise).
#### 3. Cot Tokens (Right Chart)
* **Trend:** The blue line (Llama) shows a downward trend, while the orange line (Gemini) remains relatively flat with a slight increase at the end.
* **Data Points (Approximate):**
* **Blue (Llama):** Starts at ~1725 (0.00 noise), declines to ~1650 (0.25 noise), ~1625 (0.50 noise), ~1500 (0.75 noise), and ends at ~1450 (1.00 noise).
* **Orange (Gemini):** Remains consistently low, starting at ~350 (0.00 noise), staying flat at ~350 through 0.75 noise, and rising slightly to ~375 at 1.00 noise.
---
### Key Observations
* **Performance Gap:** Gemini-2.5-flash-preview-04-17 significantly outperforms Llama-4-maverick-17b-128e-instruct-fp8 in both "Mean progress ratio" and "Mean success rate" across all noise levels.
* **Efficiency Gap:** Llama uses a much higher number of Chain-of-Thought (Cot) tokens (1450–1725 range) compared to Gemini (consistently ~350–375), despite having lower performance metrics.
* **Noise Sensitivity:** Both models are sensitive to noise, as evidenced by the degradation in progress and success rates. However, Gemini maintains a non-zero success rate even at high noise levels, whereas Llama's success rate collapses to zero at 0.50 noise.
* **Token Usage Behavior:** As noise increases, Llama's CoT token usage decreases, suggesting the model may be truncating its reasoning process or failing to generate long chains when the input is highly noisy.
### Interpretation
The data suggests that **Gemini-2.5-flash-preview-04-17 is significantly more robust and efficient** than the Llama-4-maverick variant tested.
The "Mean progress ratio" and "Mean success rate" charts demonstrate that the Llama model struggles to maintain coherence or accuracy as input noise increases. The "Cot tokens" chart provides a critical insight: Llama is "thinking" (generating tokens) much more than Gemini, yet achieving worse results. The fact that Llama's token count drops as noise increases—while its success rate is already near zero—implies that the model's reasoning capabilities are severely degraded by the noise, potentially causing it to output shorter, less coherent, or "failed" responses rather than attempting a full reasoning chain. Gemini, conversely, maintains a stable, low-token reasoning strategy that remains effective even as noise increases.