## Bar Chart: Attack Success Rate (ASR) Comparison
### Overview
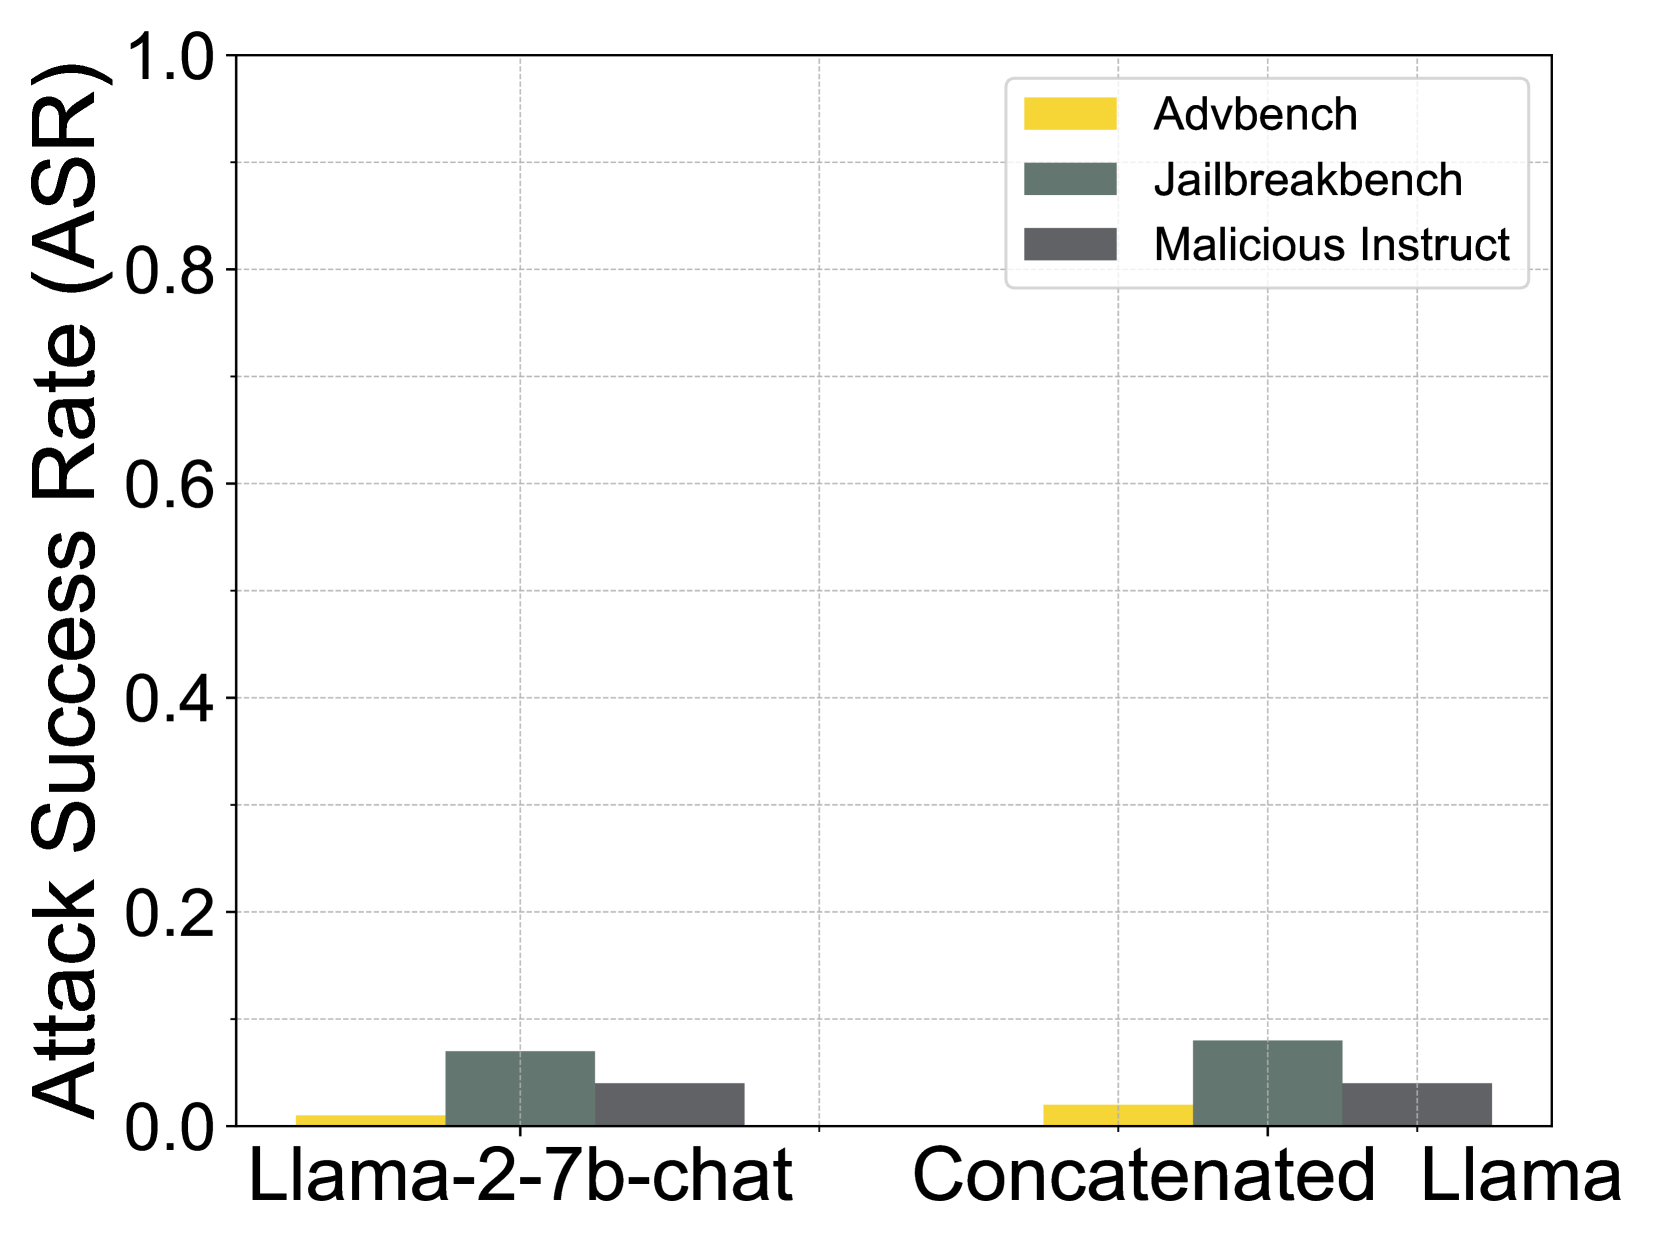
The image is a grouped bar chart comparing the Attack Success Rate (ASR) of two language models, `Llama-2-7b-chat` and `Concatenated Llama`, across three different attack benchmarks. The chart visually demonstrates that both models have very low ASR values, all below 0.1, with the `Concatenated Llama` showing marginally higher rates across all benchmarks.
### Components/Axes
* **Y-Axis:** Labeled "Attack Success Rate (ASR)". The scale is linear, ranging from 0.0 to 1.0, with major gridlines and numerical markers at intervals of 0.2 (0.0, 0.2, 0.4, 0.6, 0.8, 1.0).
* **X-Axis:** Contains two categorical labels representing the models being tested:
1. `Llama-2-7b-chat` (left group)
2. `Concatenated Llama` (right group)
* **Legend:** Positioned in the top-right corner of the chart area. It defines three data series by color:
* **Yellow:** `Advbench`
* **Dark Green:** `Jailbreakbench`
* **Dark Gray:** `Malicious Instruct`
* **Data Series:** For each model on the x-axis, there are three adjacent bars corresponding to the three benchmarks in the legend, ordered left-to-right as Yellow (`Advbench`), Dark Green (`Jailbreakbench`), Dark Gray (`Malicious Instruct`).
### Detailed Analysis
**Trend Verification:** For both models, the visual trend is consistent: the `Jailbreakbench` (dark green) bar is the tallest, followed by `Malicious Instruct` (dark gray), with `Advbench` (yellow) being the shortest. The `Concatenated Llama` bars are uniformly slightly taller than their counterparts for `Llama-2-7b-chat`.
**Approximate Data Points (Estimated from bar heights relative to y-axis):**
| Model | Benchmark | Estimated ASR |
| :--- | :--- | :--- |
| **Llama-2-7b-chat** | `Advbench` (Yellow) | ~0.01 |
| | `Jailbreakbench` (Dark Green) | ~0.07 |
| | `Malicious Instruct` (Dark Gray) | ~0.04 |
| **Concatenated Llama** | `Advbench` (Yellow) | ~0.02 |
| | `Jailbreakbench` (Dark Green) | ~0.08 |
| | `Malicious Instruct` (Dark Gray) | ~0.04 |
### Key Observations
1. **Low Overall ASR:** All recorded Attack Success Rates are very low, with the highest value (`Jailbreakbench` on `Concatenated Llama`) estimated at only 0.08 (8%).
2. **Benchmark Hierarchy:** `Jailbreakbench` consistently yields the highest ASR for both models, followed by `Malicious Instruct`, and then `Advbench`.
3. **Model Comparison:** The `Concatenated Llama` model exhibits a slightly higher susceptibility to all three attack types compared to the standard `Llama-2-7b-chat` model. The increase is most noticeable for `Advbench` (approximately doubling from ~0.01 to ~0.02) and `Jailbreakbench` (from ~0.07 to ~0.08).
4. **Visual Layout:** The chart uses a clean, white background with light gray horizontal gridlines. The legend is clearly separated in the upper right quadrant, and the bars are grouped tightly by model with clear spacing between the two model groups.
### Interpretation
This chart presents a security evaluation of two Llama-based models. The data suggests that while both models are relatively robust against the tested adversarial attacks (as evidenced by the low ASR values), their vulnerability is not uniform across different attack methodologies.
* **Attack Effectiveness:** The `Jailbreakbench` benchmark appears to be the most effective attack suite against these models, implying its prompts or techniques are better at bypassing safety alignments. `Advbench` is the least effective.
* **Impact of Model Modification:** The `Concatenated Llama` model, which likely involves some form of model merging or ensemble technique, shows a consistent, albeit small, increase in attack success rate across all benchmarks. This could indicate that the concatenation process, while potentially improving other capabilities, may introduce minor vulnerabilities or slightly degrade the model's safety guardrails compared to the base `Llama-2-7b-chat`.
* **Practical Implication:** The absolute ASR values are low enough to suggest that these specific attack benchmarks, in this testing setup, do not pose a high-probability threat. However, the relative differences are significant for researchers aiming to understand the trade-offs between model performance and safety, or the efficacy of different red-teaming benchmarks. The chart effectively communicates that model architecture choices (like concatenation) can have measurable, if subtle, effects on security posture.