## Line Chart: Computation Time vs. Sequence Length
### Overview
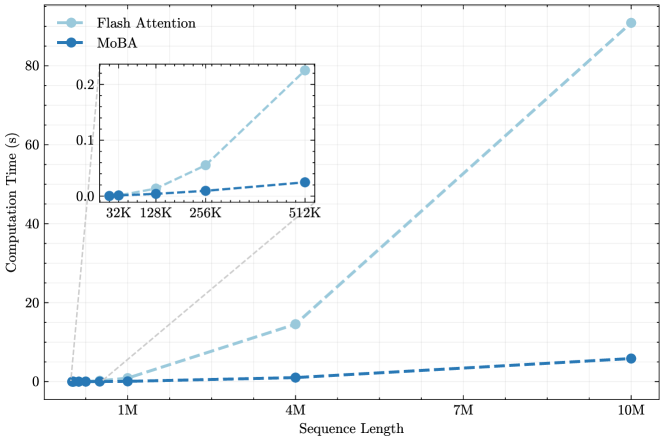
The image is a line chart comparing the computation time (in seconds) of two methods, "Flash Attention" and "MoBA," as a function of sequence length. The x-axis represents the sequence length, and the y-axis represents the computation time. There is an inset plot showing the performance for smaller sequence lengths.
### Components/Axes
* **Title:** There is no explicit title on the chart.
* **X-axis:** Sequence Length, with markers at 1M, 4M, 7M, and 10M. The inset plot's x-axis has markers at 32K, 128K, 256K, and 512K.
* **Y-axis:** Computation Time (s), with markers at 0, 20, 40, 60, and 80. The inset plot's y-axis has markers at 0.0, 0.1, and 0.2.
* **Legend:** Located at the top-left of the chart.
* Flash Attention (light blue)
* MoBA (dark blue)
### Detailed Analysis
* **Flash Attention (light blue):**
* The line slopes upward, indicating increasing computation time with increasing sequence length.
* At 1M sequence length, the computation time is approximately 0.1 s.
* At 4M sequence length, the computation time is approximately 15 s.
* At 7M sequence length, the computation time is approximately 40 s.
* At 10M sequence length, the computation time is approximately 80 s.
* Inset plot:
* At 32K sequence length, the computation time is approximately 0.002 s.
* At 128K sequence length, the computation time is approximately 0.01 s.
* At 256K sequence length, the computation time is approximately 0.05 s.
* At 512K sequence length, the computation time is approximately 0.2 s.
* **MoBA (dark blue):**
* The line slopes upward gently, indicating a slower increase in computation time with increasing sequence length compared to Flash Attention.
* At 1M sequence length, the computation time is approximately 0.2 s.
* At 4M sequence length, the computation time is approximately 1 s.
* At 7M sequence length, the computation time is approximately 3 s.
* At 10M sequence length, the computation time is approximately 6 s.
* Inset plot:
* At 32K sequence length, the computation time is approximately 0.002 s.
* At 128K sequence length, the computation time is approximately 0.005 s.
* At 256K sequence length, the computation time is approximately 0.01 s.
* At 512K sequence length, the computation time is approximately 0.02 s.
### Key Observations
* Flash Attention's computation time increases much more rapidly with sequence length than MoBA's.
* For smaller sequence lengths (as shown in the inset), the computation times for both methods are relatively close.
* At larger sequence lengths, the difference in computation time between the two methods becomes significant.
### Interpretation
The chart demonstrates that MoBA scales much better with increasing sequence length compared to Flash Attention. While Flash Attention may be faster for very short sequences, its computation time grows exponentially, making it less efficient for longer sequences. MoBA, on the other hand, exhibits a more linear growth in computation time, making it a more suitable choice for applications dealing with long sequences. The inset plot highlights that the performance difference is minimal for short sequences, suggesting that the choice between the two methods depends heavily on the typical sequence length encountered in a given application.