\n
## Chart: Computation Time vs. Sequence Length for Flash Attention and MoBA
### Overview
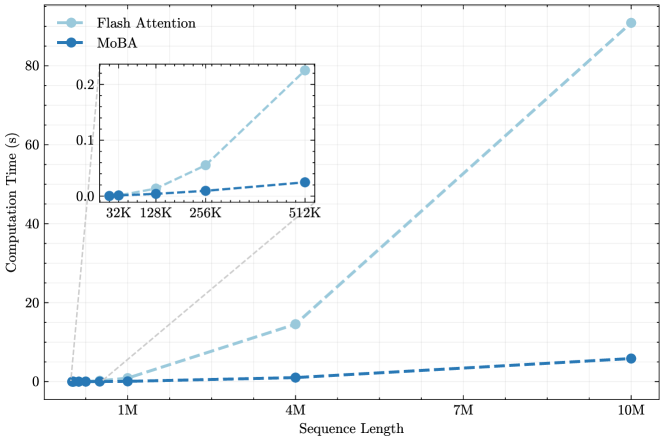
This chart compares the computation time of two methods, "Flash Attention" and "MoBA", as a function of sequence length. The x-axis represents sequence length, and the y-axis represents computation time in seconds. A zoomed-in inset chart displays the computation time for shorter sequence lengths.
### Components/Axes
* **X-axis:** Sequence Length (labeled as "Sequence Length"). Scale: 1M, 4M, 7M, 10M. Inset chart scale: 32K, 128K, 256K, 512K.
* **Y-axis:** Computation Time (labeled as "Computation Time (s)"). Scale: 0 to 80 seconds.
* **Legend:**
* "Flash Attention" - Light blue dashed line with circular markers.
* "MoBA" - Dark blue dashed line with circular markers.
* **Inset Chart:** Located in the top-left corner of the main chart. It focuses on sequence lengths from 32K to 512K.
### Detailed Analysis
**Flash Attention (Light Blue):**
The line representing Flash Attention slopes upward, indicating that computation time increases with sequence length.
* At 1M sequence length: Approximately 0.5 seconds.
* At 4M sequence length: Approximately 17 seconds.
* At 7M sequence length: Approximately 45 seconds.
* At 10M sequence length: Approximately 82 seconds.
* Inset Chart:
* At 32K sequence length: Approximately 0.02 seconds.
* At 128K sequence length: Approximately 0.06 seconds.
* At 256K sequence length: Approximately 0.1 seconds.
* At 512K sequence length: Approximately 0.3 seconds.
**MoBA (Dark Blue):**
The line representing MoBA also slopes upward, but at a much shallower rate than Flash Attention.
* At 1M sequence length: Approximately 0.1 seconds.
* At 4M sequence length: Approximately 2.5 seconds.
* At 7M sequence length: Approximately 5 seconds.
* At 10M sequence length: Approximately 8 seconds.
* Inset Chart:
* At 32K sequence length: Approximately 0.01 seconds.
* At 128K sequence length: Approximately 0.03 seconds.
* At 256K sequence length: Approximately 0.05 seconds.
* At 512K sequence length: Approximately 0.1 seconds.
### Key Observations
* Flash Attention exhibits a significantly higher computation time than MoBA across all sequence lengths.
* The computation time for Flash Attention increases more rapidly with sequence length compared to MoBA.
* The inset chart shows that the difference in computation time between the two methods is less pronounced for shorter sequence lengths (up to 512K).
* MoBA maintains a relatively flat computation time curve, suggesting better scalability with increasing sequence length.
### Interpretation
The data suggests that MoBA is more efficient than Flash Attention, particularly for longer sequence lengths. The linear increase in computation time for MoBA indicates a more scalable approach. Flash Attention, while potentially faster for very short sequences, becomes computationally expensive as the sequence length grows. This difference in scalability could be due to algorithmic differences or optimization strategies employed in each method. The inset chart highlights that the performance gap between the two methods becomes more significant as the sequence length increases beyond 512K. This information is valuable for choosing the appropriate method based on the expected sequence length and computational resources available. The chart demonstrates a clear trade-off between performance and scalability, with MoBA prioritizing scalability and Flash Attention potentially offering faster performance for limited sequence lengths.