TECHNICAL ASSET FINGERPRINT
324bae663ca06a01977ef79d
Click to view fullscreen
Press ESC or click to close
FOUND IN PAPERS
EXPERT: gemini-2.5-flash-free VERSION 1
RUNTIME: google-free/gemini-2.5-flash
INTEL_VERIFIED
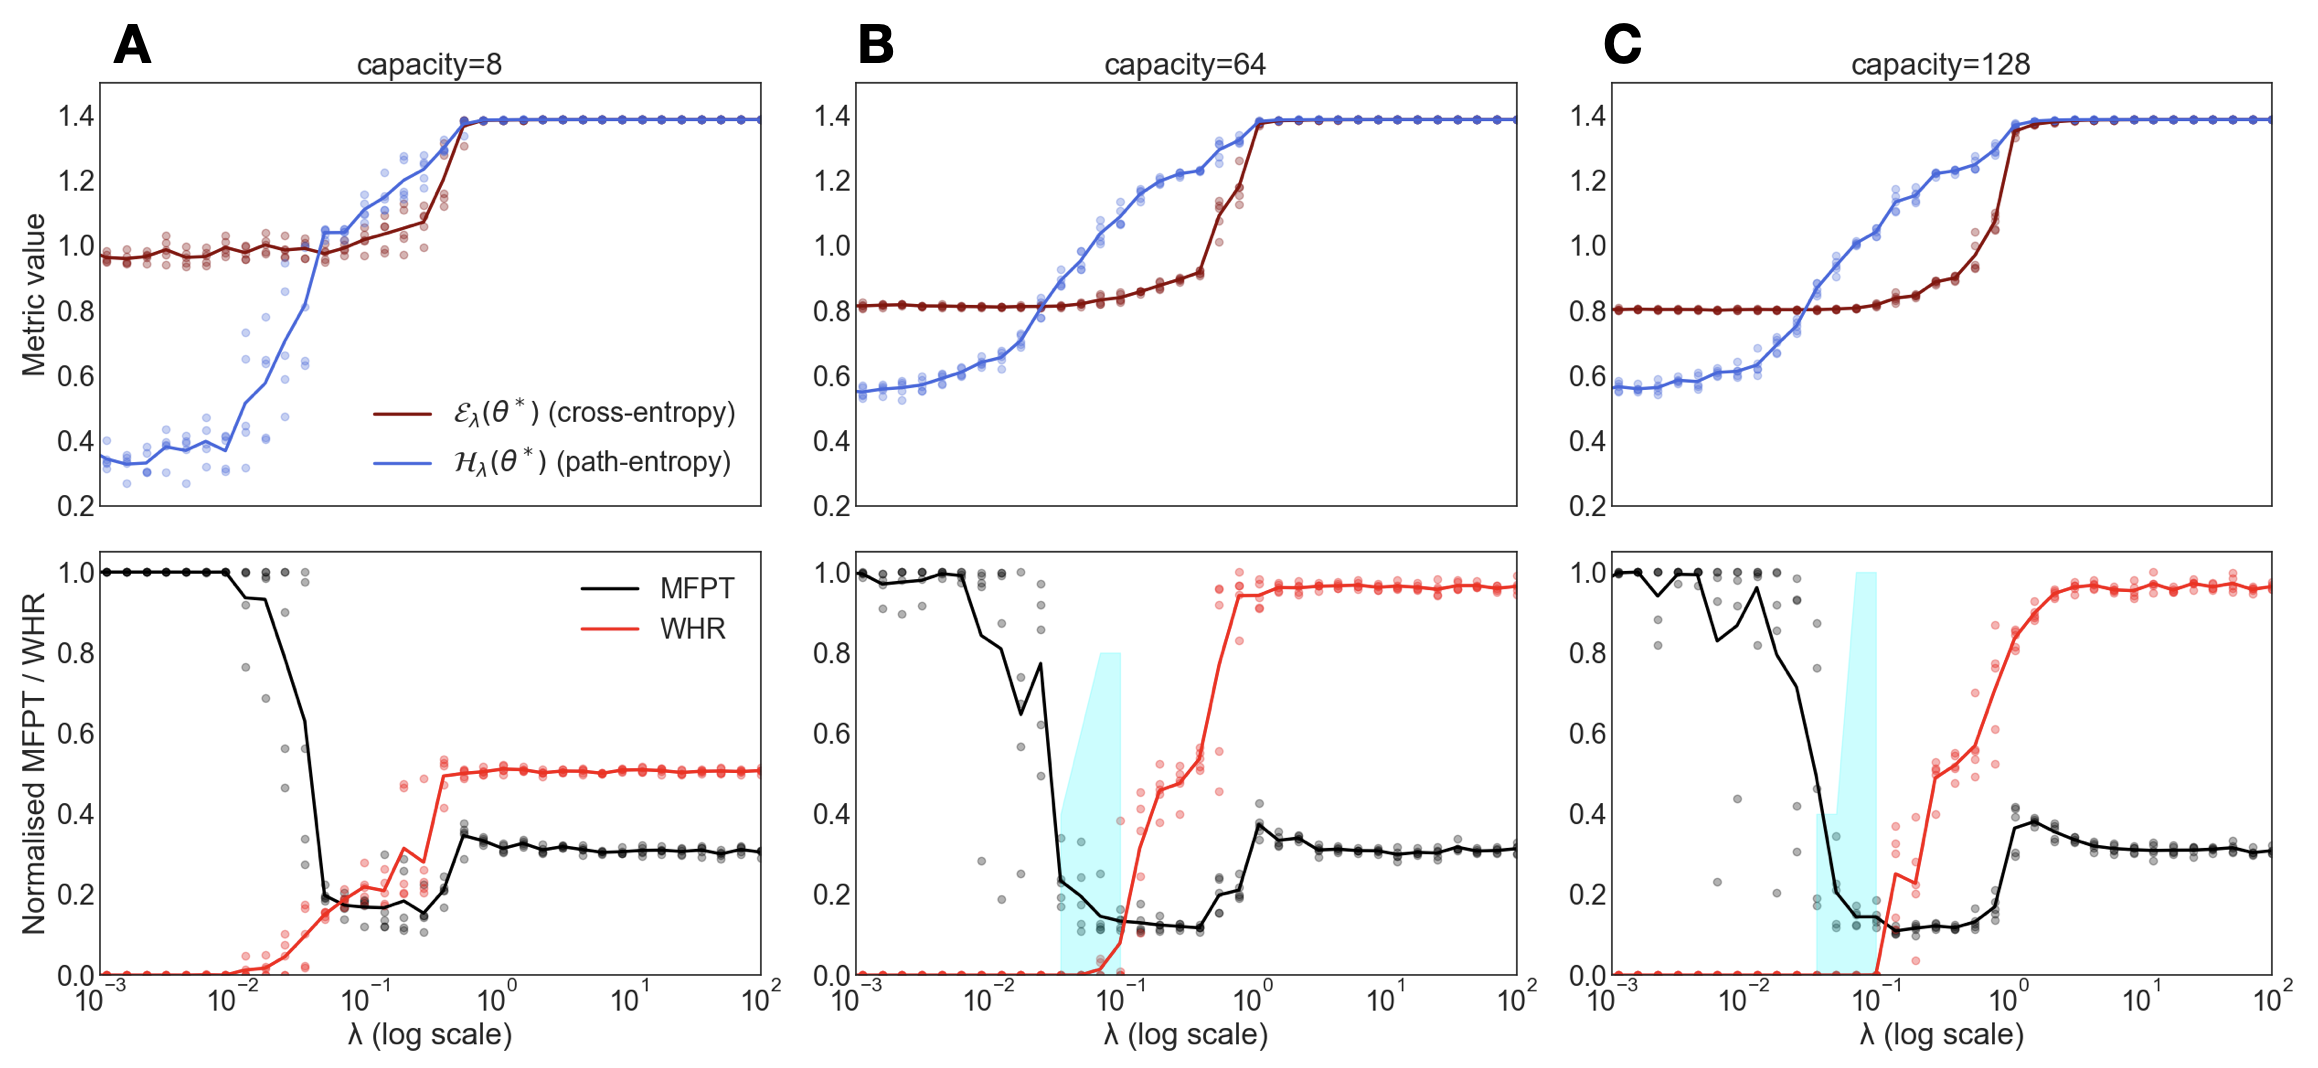
## Chart Type: Multiple Line Charts: Performance Metrics vs. Regularization Parameter (λ) for Varying Model Capacity
### Overview
The image displays a 3x2 grid of line charts, organized into three columns (A, B, C) and two rows. Each column represents a different model "capacity" (8, 64, and 128, respectively). The top row of charts plots two "Metric values" against a regularization parameter λ, while the bottom row plots "Normalised MFPT / WHR" against the same λ. Each data series is represented by a solid line, with individual data points shown as semi-transparent scattered dots, indicating variability. The x-axis for all charts is on a logarithmic scale.
### Components/Axes
**Overall Structure:**
The figure is divided into three main columns, labeled A, B, and C at the top-left of each column.
- **Column A:** Titled "capacity=8"
- **Column B:** Titled "capacity=64"
- **Column C:** Titled "capacity=128"
**Shared Axes:**
- **X-axis (bottom-center):** "λ (log scale)". The scale ranges from 10⁻³ to 10². Major tick marks are at 10⁻³, 10⁻², 10⁻¹, 10⁰, 10¹, 10².
- **Left Y-axis (centered for top row):** "Metric value". The scale ranges from 0.2 to 1.4. Major tick marks are at 0.2, 0.4, 0.6, 0.8, 1.0, 1.2, 1.4.
- **Left Y-axis (centered for bottom row):** "Normalised MFPT / WHR". The scale ranges from 0.0 to 1.0. Major tick marks are at 0.0, 0.2, 0.4, 0.6, 0.8, 1.0.
**Legends:**
- **Top Charts Legend (located in the bottom-left of Chart A, Top):**
- Brown line: $\mathcal{E}_{\lambda}(\theta^*)$ (cross-entropy)
- Blue line: $\mathcal{H}_{\lambda}(\theta^*)$ (path-entropy)
- **Bottom Charts Legend (located in the top-right of Chart A, Bottom):**
- Black line: MFPT
- Red line: WHR
**Shaded Regions:**
- In the bottom charts of columns B and C, there is a light cyan vertical shaded region. This region spans approximately from λ = 10⁻¹·⁷ (around 0.02) to λ = 10⁻⁰·⁵ (around 0.3).
### Detailed Analysis
**Column A: capacity=8**
* **Top Chart A: Metric value vs. λ**
* **$\mathcal{E}_{\lambda}(\theta^*)$ (cross-entropy) - Brown Line:**
* **Trend:** Starts around 0.95-1.0 at λ = 10⁻³, remains relatively flat until approximately λ = 10⁻¹, then increases sharply.
* **Data Points:** Rises from ~1.0 at λ = 10⁻¹ to ~1.38 at λ = 10⁰, then flattens out at ~1.38-1.4 for higher λ values.
* **$\mathcal{H}_{\lambda}(\theta^*)$ (path-entropy) - Blue Line:**
* **Trend:** Starts around 0.3-0.4 at λ = 10⁻³, increases steadily, crosses the brown line, then increases sharply.
* **Data Points:** Rises from ~0.35 at λ = 10⁻³ to ~1.0 at λ = 10⁻⁰·⁵. It crosses the brown line at approximately λ = 10⁻⁰·⁵ (around 0.3) where both metrics are around 1.0. It then continues to rise sharply to ~1.38-1.4 at λ = 10⁰, and flattens for higher λ values.
* **Variability:** Both lines show moderate scatter of individual data points around the mean line, particularly in the rising phase.
* **Bottom Chart A: Normalised MFPT / WHR vs. λ**
* **MFPT - Black Line:**
* **Trend:** Starts at 1.0 at λ = 10⁻³, remains high and relatively flat, then drops sharply, followed by a slight increase and then flattens.
* **Data Points:** Stays at ~1.0 until λ ≈ 10⁻², then drops sharply to a minimum of ~0.15-0.2 around λ = 10⁻¹. It then rises to ~0.3-0.35 at λ = 10⁰ and remains flat at this level for higher λ.
* **WHR - Red Line:**
* **Trend:** Starts at 0.0, remains low, then increases sharply and flattens.
* **Data Points:** Stays at ~0.0 until λ ≈ 10⁻², then increases sharply from ~0.0 at λ = 10⁻² to ~0.5-0.55 at λ = 10⁻⁰·⁵, and flattens at this level for higher λ values.
* **Variability:** Both lines show moderate scatter of individual data points, especially during the sharp transitions.
**Column B: capacity=64**
* **Top Chart B: Metric value vs. λ**
* **$\mathcal{E}_{\lambda}(\theta^*)$ (cross-entropy) - Brown Line:**
* **Trend:** Starts lower than in A, remains flat, then increases sharply.
* **Data Points:** Starts around 0.8 at λ = 10⁻³, stays flat until λ ≈ 10⁻⁰·⁵, then rises sharply to ~1.38-1.4 at λ = 10⁰, and flattens.
* **$\mathcal{H}_{\lambda}(\theta^*)$ (path-entropy) - Blue Line:**
* **Trend:** Starts higher than in A, increases steadily, crosses the brown line, then increases sharply.
* **Data Points:** Starts around 0.55-0.6 at λ = 10⁻³, increases to ~0.85 at λ = 10⁻⁰·⁵, where it crosses the brown line. It then rises sharply to ~1.38-1.4 at λ = 10⁰, and flattens.
* **Variability:** Similar scatter to Chart A.
* **Bottom Chart B: Normalised MFPT / WHR vs. λ**
* **MFPT - Black Line:**
* **Trend:** Similar to A, but the minimum is lower.
* **Data Points:** Stays at ~1.0 until λ ≈ 10⁻², then drops sharply to a minimum of ~0.1 at λ = 10⁻¹. It then rises to ~0.3 at λ = 10⁰ and remains flat.
* **WHR - Red Line:**
* **Trend:** Similar to A, but rises to a higher plateau.
* **Data Points:** Stays at ~0.0 until λ ≈ 10⁻¹, then increases sharply to ~0.95-1.0 at λ = 10⁰, and flattens at this level.
* **Shaded Region (Light Cyan):** Highlights the region from approximately λ = 0.02 to λ = 0.3, where MFPT is at its minimum and WHR is in its initial rising phase.
* **Variability:** Similar scatter to Chart A.
**Column C: capacity=128**
* **Top Chart C: Metric value vs. λ**
* **$\mathcal{E}_{\lambda}(\theta^*)$ (cross-entropy) - Brown Line:**
* **Trend:** Very similar to Chart B.
* **Data Points:** Starts around 0.8 at λ = 10⁻³, stays flat until λ ≈ 10⁻⁰·⁵, then rises sharply to ~1.38-1.4 at λ = 10⁰, and flattens.
* **$\mathcal{H}_{\lambda}(\theta^*)$ (path-entropy) - Blue Line:**
* **Trend:** Very similar to Chart B.
* **Data Points:** Starts around 0.55-0.6 at λ = 10⁻³, increases to ~0.85 at λ = 10⁻⁰·⁵, where it crosses the brown line. It then rises sharply to ~1.38-1.4 at λ = 10⁰, and flattens.
* **Variability:** Similar scatter to Chart A and B.
* **Bottom Chart C: Normalised MFPT / WHR vs. λ**
* **MFPT - Black Line:**
* **Trend:** Very similar to Chart B.
* **Data Points:** Stays at ~1.0 until λ ≈ 10⁻², then drops sharply to a minimum of ~0.1 at λ = 10⁻¹. It then rises to ~0.3 at λ = 10⁰ and remains flat.
* **WHR - Red Line:**
* **Trend:** Very similar to Chart B.
* **Data Points:** Stays at ~0.0 until λ ≈ 10⁻¹, then increases sharply to ~0.95-1.0 at λ = 10⁰, and flattens at this level.
* **Shaded Region (Light Cyan):** Highlights the region from approximately λ = 0.02 to λ = 0.3, identical to Chart B.
* **Variability:** Similar scatter to Chart A and B.
### Key Observations
1. **Impact of Capacity on Top Metrics ($\mathcal{E}_{\lambda}(\theta^*)$ and $\mathcal{H}_{\lambda}(\theta^*)$):**
* As capacity increases from 8 to 64 (and then to 128), the initial value of cross-entropy ($\mathcal{E}_{\lambda}(\theta^*)$) at low λ decreases (from ~1.0 to ~0.8).
* Conversely, the initial value of path-entropy ($\mathcal{H}_{\lambda}(\theta^*)$) at low λ increases (from ~0.35 to ~0.55-0.6).
* The crossover point between cross-entropy and path-entropy shifts slightly to the right (higher λ) and higher in metric value as capacity increases. For capacity=8, crossover is around λ=0.3, metric=1.0. For capacity=64 and 128, crossover is around λ=0.3, metric=0.85.
* All top metrics eventually converge to a high value (~1.38-1.4) for large λ, regardless of capacity.
2. **Impact of Capacity on Bottom Metrics (MFPT and WHR):**
* The general shape of MFPT (black line) and WHR (red line) curves is consistent across all capacities: MFPT drops sharply, then slightly recovers, while WHR rises sharply.
* As capacity increases, the minimum value of MFPT decreases (from ~0.15-0.2 for capacity=8 to ~0.1 for capacity=64 and 128).
* As capacity increases, the maximum value of WHR increases (from ~0.5-0.55 for capacity=8 to ~0.95-1.0 for capacity=64 and 128). This suggests higher capacity allows for better WHR performance.
* The sharp transitions for both MFPT and WHR occur in a similar range of λ (roughly between 10⁻² and 10⁰) across all capacities.
3. **Shaded Region Significance:**
* The cyan shaded region in bottom charts B and C highlights a range of λ (approximately 0.02 to 0.3) where MFPT reaches its minimum value, and WHR is in its steep rising phase but has not yet reached its plateau. This region appears to be where MFPT is minimized while WHR is still relatively low, suggesting a trade-off or a specific regime of interest. This region is not present in Chart A, possibly because the WHR plateau is lower for capacity=8.
4. **Relationship between Top and Bottom Metrics:**
* The sharp increase in both cross-entropy and path-entropy (top charts) generally coincides with the sharp drop in MFPT and the sharp rise in WHR (bottom charts). This suggests a transition point in model behavior as λ increases.
### Interpretation
The data presented illustrates the behavior of different metrics—cross-entropy ($\mathcal{E}_{\lambda}(\theta^*)$), path-entropy ($\mathcal{H}_{\lambda}(\theta^*)$), Mean First Passage Time (MFPT), and Winning Hand Rate (WHR)—as a function of a regularization parameter λ, across varying model capacities.
The top row of charts suggests a phase transition in the model's behavior as λ increases. For small λ, cross-entropy is relatively high (especially for lower capacity), while path-entropy is low. As λ increases, path-entropy rises, eventually surpassing cross-entropy, and both metrics converge to a high value. This could indicate a shift from a regime where the model prioritizes fitting the data (low cross-entropy for high capacity) to one where it is heavily regularized, leading to higher entropy values. The initial decrease in cross-entropy and increase in path-entropy with higher capacity at low λ might imply that larger models can achieve better initial data fitting while also having more complex "paths" or solutions.
The bottom row of charts provides insights into the model's performance and efficiency. MFPT, likely representing some form of "time to solution" or "exploration cost," drops significantly as λ increases, suggesting that regularization helps the model find solutions more quickly or efficiently. Concurrently, WHR, likely a measure of success or accuracy, increases sharply. This indicates that there's an optimal range of λ where the model becomes both efficient (low MFPT) and effective (high WHR).
The most striking observation is the impact of capacity. Higher capacity (64 and 128) leads to a lower minimum MFPT and a significantly higher maximum WHR compared to lower capacity (8). This implies that larger models, when appropriately regularized, can achieve superior performance. The convergence of the top metrics to a similar high value for large λ across all capacities suggests that excessive regularization eventually dominates the model's intrinsic capacity, leading to a similar, potentially over-regularized, state.
The shaded region in the bottom charts for capacities 64 and 128 highlights a "sweet spot" for λ where MFPT is minimized. While WHR is still rising in this region, it suggests a trade-off: one might choose a λ in this region to minimize MFPT, even if it means not achieving the absolute maximum WHR. The absence of this shaded region for capacity=8 might indicate that for lower capacity, this distinct "sweet spot" where MFPT is minimized while WHR is still low is less pronounced or less desirable, as the maximum WHR achieved is already much lower.
In essence, the figure demonstrates that both model capacity and the regularization parameter λ play crucial roles in determining a model's performance and efficiency, with higher capacity generally enabling better outcomes, and λ acting as a critical knob to navigate between different operational regimes.
DECODING INTELLIGENCE...