\n
## Chart: Metric Value vs. Lambda for Different Capacities
### Overview
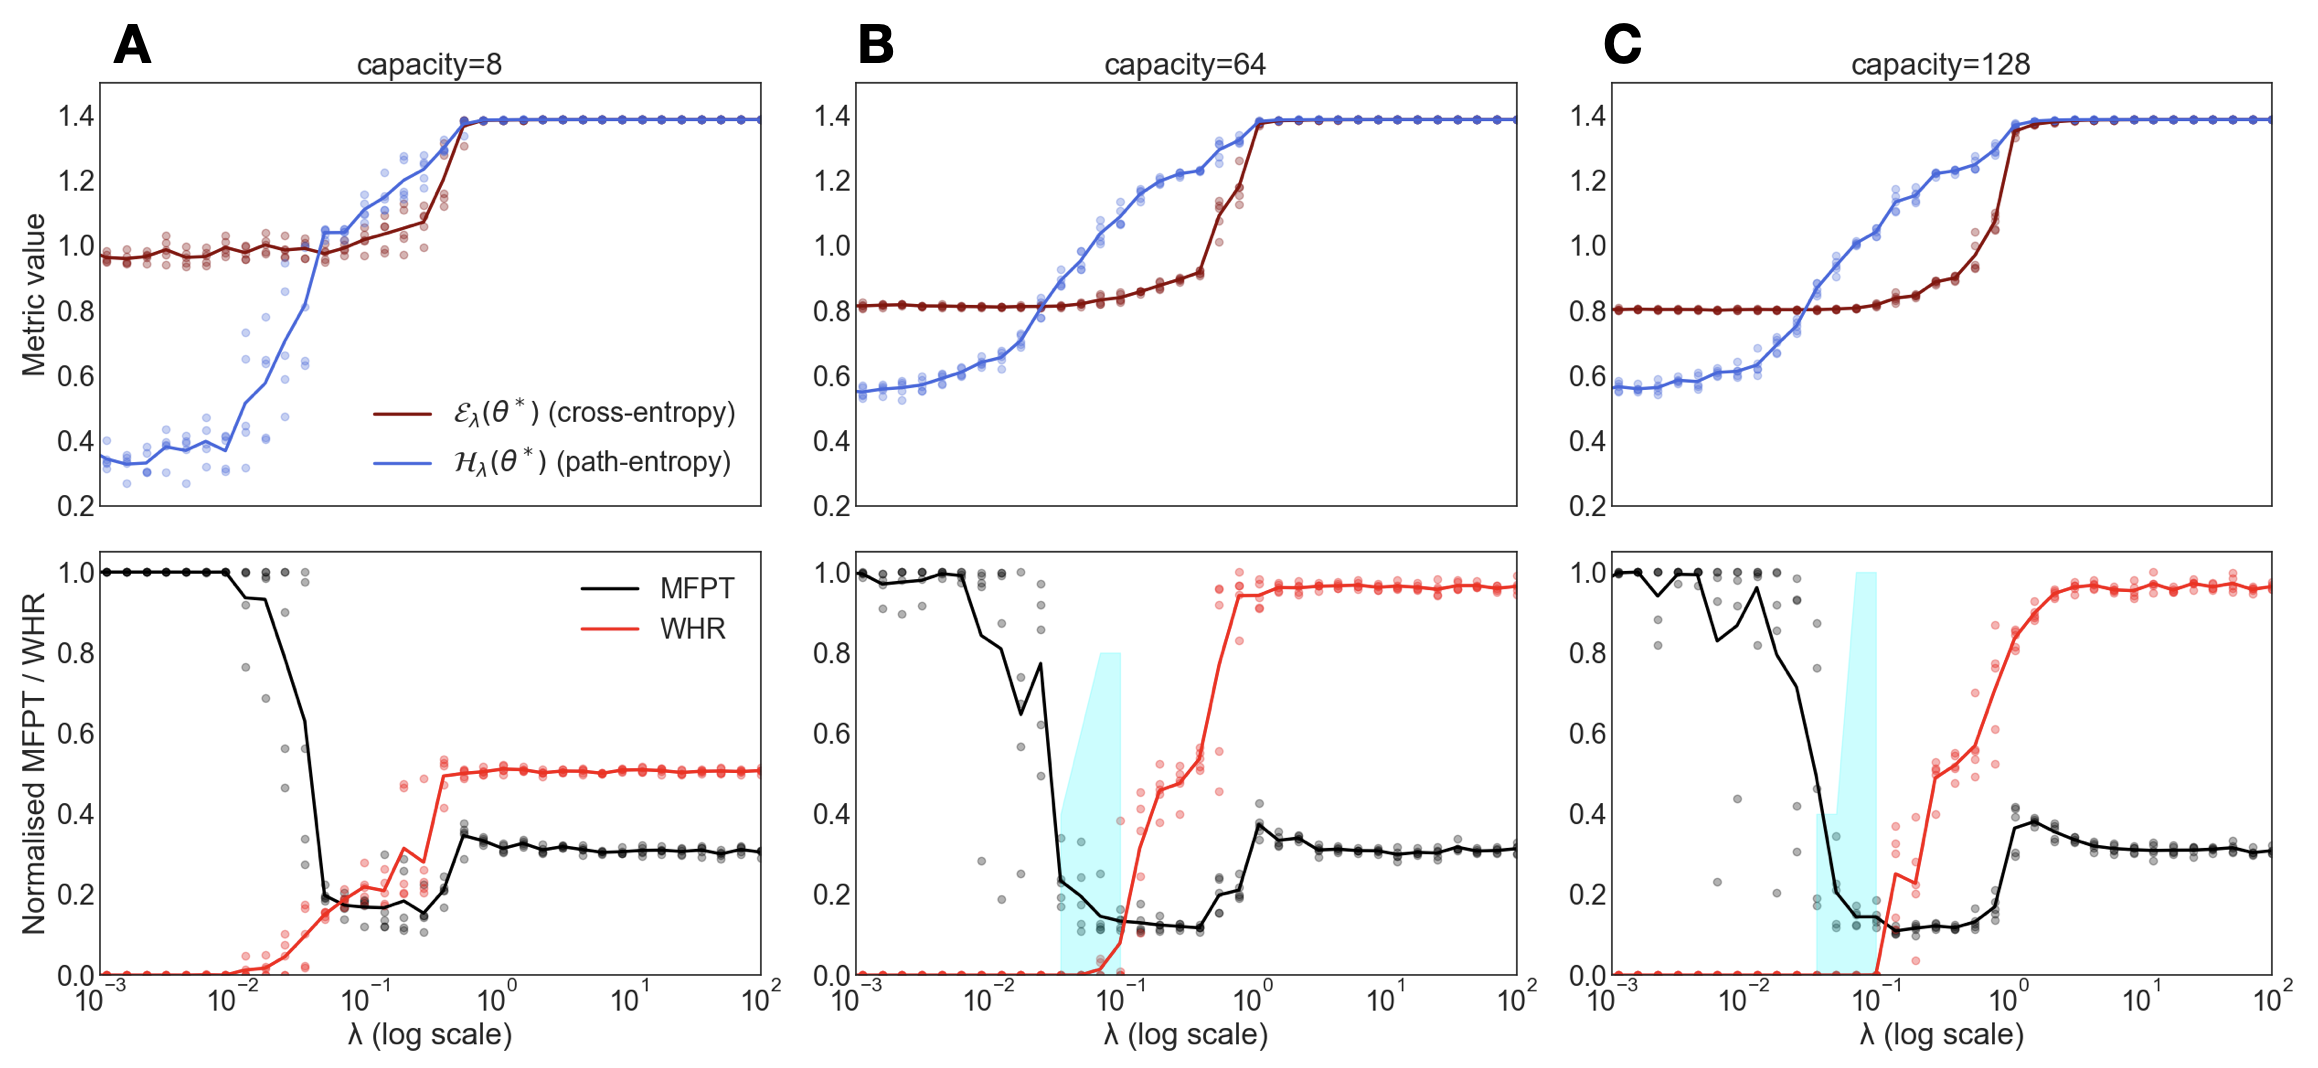
The image presents three separate charts (A, B, and C) displaying the relationship between a metric value and lambda (λ) for different network capacities (8, 64, and 128 respectively). Each chart contains two line plots representing cross-entropy and path-entropy, along with scatter plots representing MFPT (Mean First Passage Time) and WHR (Width-to-Height Ratio). The x-axis is on a logarithmic scale.
### Components/Axes
* **X-axis (all charts):** λ (Lambda) - labeled as "λ (log scale)". Scale ranges from 10<sup>-2</sup> to 10<sup>2</sup>.
* **Y-axis (top plots):** Metric value. Scale ranges from 0 to 1.4.
* **Y-axis (bottom plots):** Normalized MFPT / WHR. Scale ranges from 0 to 1.
* **Legend (all charts):**
* Red Line: ε<sub>l</sub>(θ<sup>*</sup>) (cross-entropy)
* Blue Line: H<sub>l</sub>(θ<sup>*</sup>) (path-entropy)
* Grey Circles: MFPT
* Black Circles: WHR
* **Titles:**
* A: capacity=8
* B: capacity=64
* C: capacity=128
### Detailed Analysis or Content Details
**Chart A (capacity=8):**
* **Cross-Entropy (Red Line):** The line starts at approximately 0.15 at λ = 10<sup>-2</sup>, increases rapidly to a peak of around 1.25 at λ ≈ 0.01, then decreases to approximately 0.75 at λ = 10<sup>2</sup>.
* **Path-Entropy (Blue Line):** The line starts at approximately 0.1 at λ = 10<sup>-2</sup>, increases steadily to a plateau around 1.35 between λ ≈ 0.01 and λ = 10<sup>2</sup>.
* **MFPT (Grey Circles):** The scatter plot shows a high concentration of points around 0.1-0.2 for λ < 0.1, then a rapid increase to approximately 0.8 at λ ≈ 0.1, followed by a decrease to around 0.2 at λ = 10<sup>2</sup>.
* **WHR (Black Circles):** The scatter plot shows a concentration of points around 0.6-0.8 for λ < 0.1, then a sharp decrease to approximately 0.2 at λ ≈ 0.1, followed by a relatively stable value around 0.2-0.3 at λ = 10<sup>2</sup>.
**Chart B (capacity=64):**
* **Cross-Entropy (Red Line):** The line starts at approximately 0.2 at λ = 10<sup>-2</sup>, increases to a peak of around 1.2 at λ ≈ 0.01, then fluctuates between 0.7 and 1.1 until λ = 10<sup>2</sup>. There is a large spike to approximately 1.3 at λ ≈ 0.1.
* **Path-Entropy (Blue Line):** The line starts at approximately 0.2 at λ = 10<sup>-2</sup>, increases steadily to a plateau around 1.3 between λ ≈ 0.01 and λ = 10<sup>2</sup>.
* **MFPT (Grey Circles):** The scatter plot shows a concentration of points around 0.2-0.3 for λ < 0.1, then a rapid increase to approximately 0.8 at λ ≈ 0.1, followed by a decrease to around 0.3 at λ = 10<sup>2</sup>.
* **WHR (Black Circles):** The scatter plot shows a concentration of points around 0.6-0.8 for λ < 0.1, then a sharp decrease to approximately 0.2 at λ ≈ 0.1, followed by a relatively stable value around 0.2-0.4 at λ = 10<sup>2</sup>.
**Chart C (capacity=128):**
* **Cross-Entropy (Red Line):** The line starts at approximately 0.15 at λ = 10<sup>-2</sup>, increases to a peak of around 1.2 at λ ≈ 0.01, then fluctuates between 0.7 and 1.1 until λ = 10<sup>2</sup>.
* **Path-Entropy (Blue Line):** The line starts at approximately 0.15 at λ = 10<sup>-2</sup>, increases steadily to a plateau around 1.3 between λ ≈ 0.01 and λ = 10<sup>2</sup>.
* **MFPT (Grey Circles):** The scatter plot shows a concentration of points around 0.1-0.2 for λ < 0.1, then a rapid increase to approximately 0.8 at λ ≈ 0.1, followed by a decrease to around 0.3 at λ = 10<sup>2</sup>.
* **WHR (Black Circles):** The scatter plot shows a concentration of points around 0.6-0.8 for λ < 0.1, then a sharp decrease to approximately 0.2 at λ ≈ 0.1, followed by a relatively stable value around 0.2-0.4 at λ = 10<sup>2</sup>.
### Key Observations
* The path-entropy consistently plateaus at a higher value than the cross-entropy across all capacities.
* MFPT and WHR both exhibit a similar trend: high values at low lambda, a sharp decrease around λ ≈ 0.1, and then stabilization at lower values.
* The cross-entropy shows more variability, especially at higher capacities (B and C).
* The spike in cross-entropy at λ ≈ 0.1 in Chart B is a notable outlier.
### Interpretation
The charts demonstrate the relationship between network capacity, a parameter λ, and various metrics related to network performance (cross-entropy, path-entropy, MFPT, and WHR). The consistent plateau in path-entropy suggests that, beyond a certain point, increasing the complexity of the path does not significantly improve the metric. The behavior of MFPT and WHR indicates a transition in network behavior around λ ≈ 0.1, potentially representing a shift in the dominant pathways or a change in the network's structure. The outlier spike in cross-entropy for capacity=64 at λ ≈ 0.1 could indicate a local optimum or a region of instability in the network's learning process. The normalization of MFPT and WHR suggests a comparison of these metrics relative to their maximum values, allowing for a more meaningful assessment of their impact on overall network performance. The increasing capacity (from A to C) appears to smooth out the cross-entropy curve, potentially indicating a more stable learning process with larger networks.