TECHNICAL ASSET FINGERPRINT
324bae663ca06a01977ef79d
Click to view fullscreen
Press ESC or click to close
FOUND IN PAPERS
EXPERT: healer-alpha-free VERSION 1
RUNTIME: free/openrouter/healer-alpha
INTEL_VERIFIED
## Multi-Panel Line Charts: Regularization Strength (λ) vs. Model Performance Metrics
### Overview
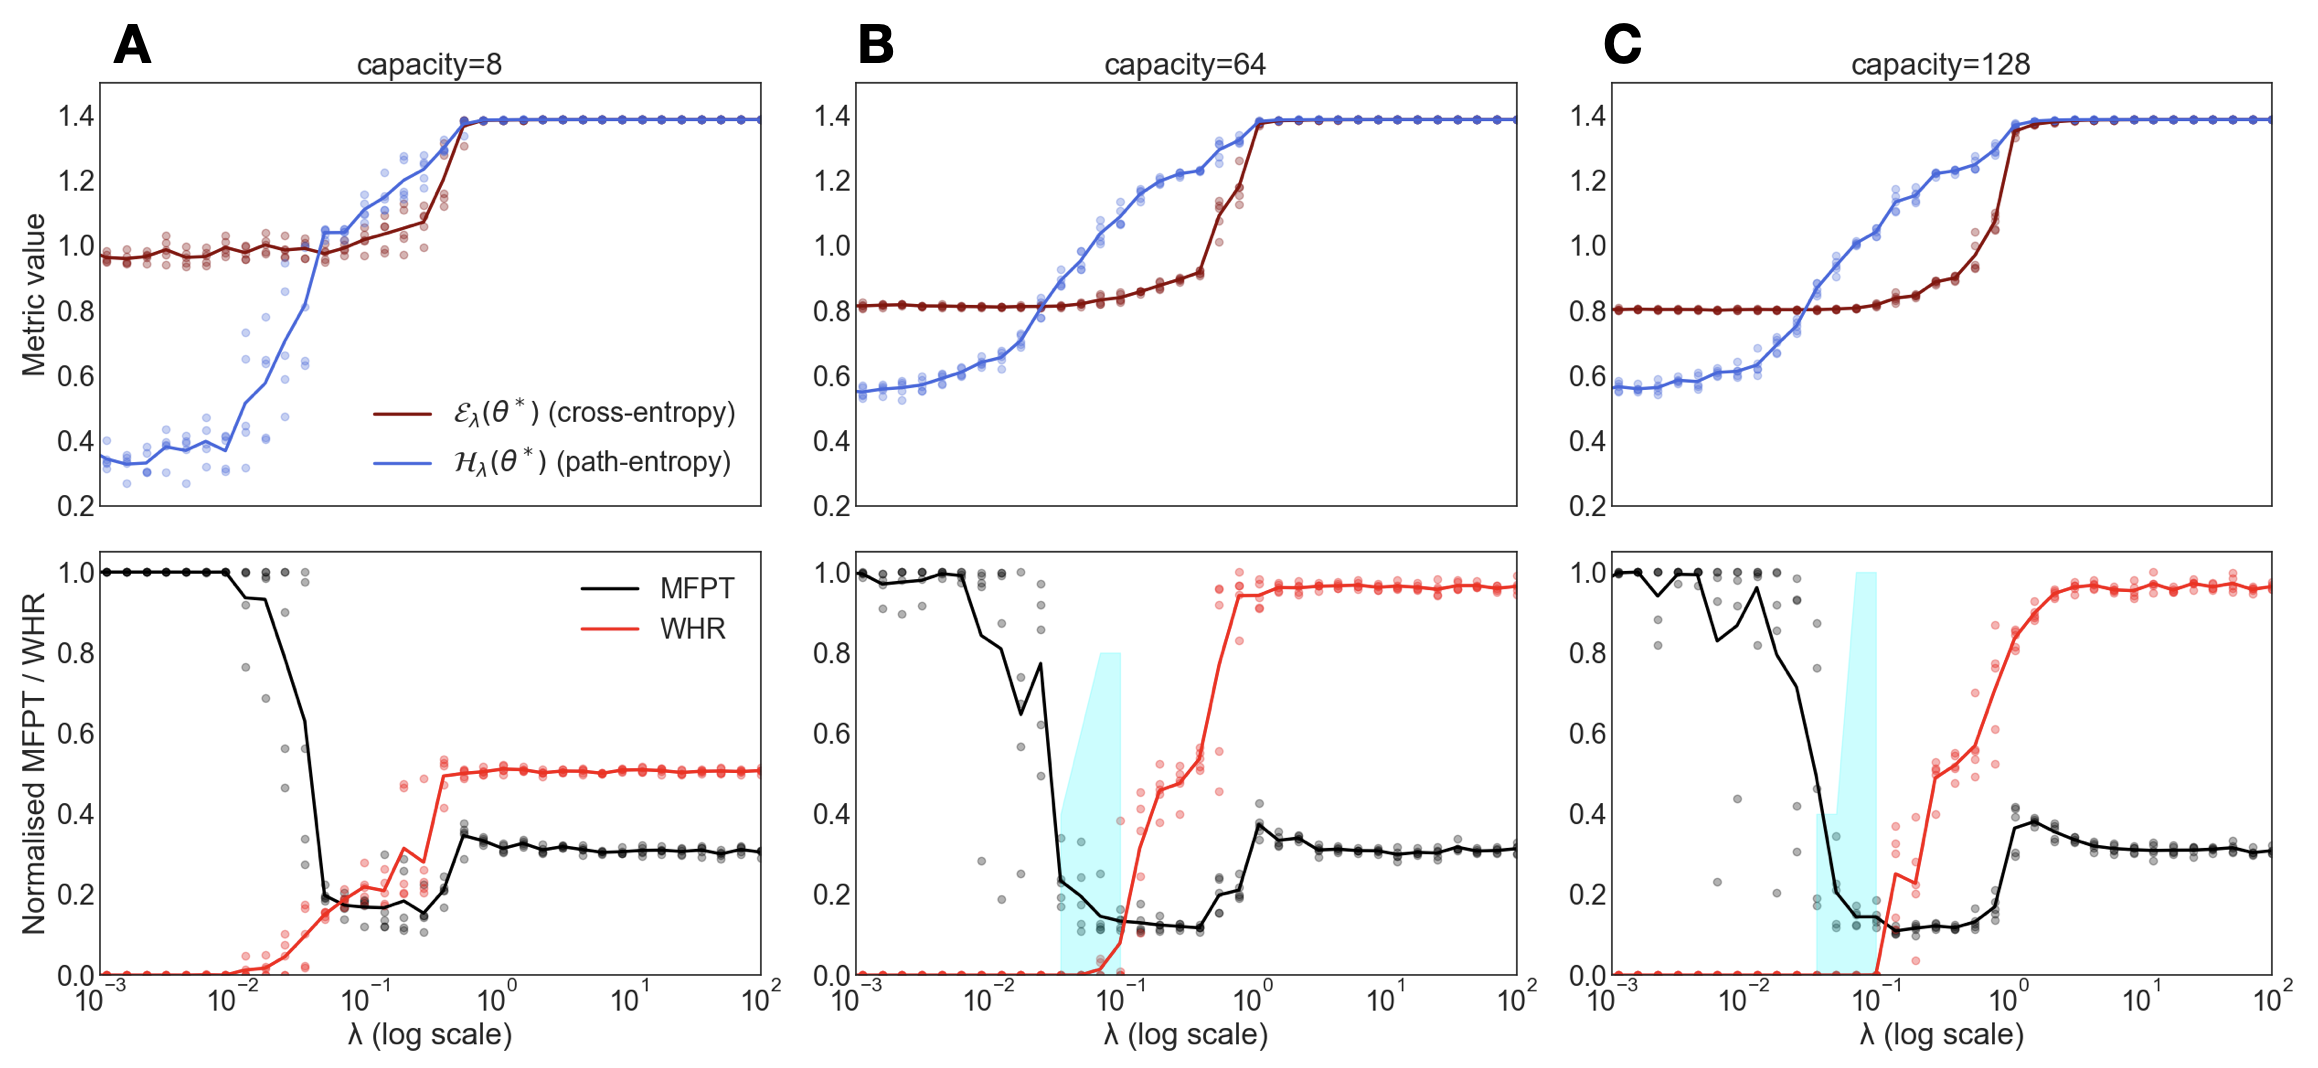
The image displays a set of three multi-panel charts (labeled A, B, C) from a scientific or technical study. Each panel corresponds to a different model "capacity" (8, 64, 128). Within each panel, there are two vertically stacked subplots sharing a common x-axis. The charts plot various performance metrics against a regularization parameter λ on a logarithmic scale. The data is presented as scatter points with overlaid trend lines.
### Components/Axes
* **Panels:** Three main panels arranged horizontally, labeled **A**, **B**, and **C** in the top-left corner of each.
* **Panel A Title:** `capacity=8`
* **Panel B Title:** `capacity=64`
* **Panel C Title:** `capacity=128`
* **X-Axis (Common to all subplots):**
* **Label:** `λ (log scale)`
* **Scale:** Logarithmic, ranging from `10^-3` to `10^2`. Major ticks are at `10^-3`, `10^-2`, `10^-1`, `10^0`, `10^1`, `10^2`.
* **Top Subplot (Per Panel):**
* **Y-Axis Label:** `Metric value`
* **Scale:** Linear, from `0.2` to `1.4`. Major ticks at `0.2`, `0.4`, `0.6`, `0.8`, `1.0`, `1.2`, `1.4`.
* **Legend (Located in Panel A, top subplot):**
* **Dark Red Line/Points:** `ε_λ(θ*) (cross-entropy)`
* **Blue Line/Points:** `H_λ(θ*) (path-entropy)`
* **Bottom Subplot (Per Panel):**
* **Y-Axis Label:** `Normalised MFPT / WHR`
* **Scale:** Linear, from `0.0` to `1.0`. Major ticks at `0.0`, `0.2`, `0.4`, `0.6`, `0.8`, `1.0`.
* **Legend (Located in Panel A, bottom subplot):**
* **Black Line/Points:** `MFPT`
* **Red Line/Points:** `WHR`
* **Additional Visual Element:** Light blue shaded vertical regions appear in the bottom subplots of panels B and C, roughly between λ = `10^-1.5` and `10^-0.5`.
### Detailed Analysis
**Top Subplots (Cross-entropy & Path-entropy):**
* **Trend Verification:**
* **Cross-entropy (Dark Red):** Starts near `1.0` at low λ. Shows a slight dip or plateau before λ=`10^-1`, then increases sharply, plateauing at approximately `1.4` for λ > `10^0`.
* **Path-entropy (Blue):** Starts significantly lower than cross-entropy at low λ (approx. `0.35` in A, `0.55` in B/C). Increases steadily with λ, converging with the cross-entropy line at the high plateau of `~1.4`.
* **Capacity Effect:** The initial value of path-entropy at low λ increases with capacity (A: ~0.35, B/C: ~0.55). The transition to the high plateau appears slightly smoother with higher capacity.
**Bottom Subplots (MFPT & WHR):**
* **Trend Verification:**
* **MFPT (Black):** Starts at the maximum normalized value of `1.0` at low λ. Undergoes a sharp, precipitous drop between λ=`10^-2` and `10^-1`, reaching a minimum near `0.1-0.2`. For λ > `10^-1`, it recovers slightly and stabilizes around `0.3-0.4`.
* **WHR (Red):** Starts near `0.0` at low λ. Begins a sharp increase at approximately the same λ where MFPT drops (`10^-2` to `10^-1`). It plateaus at a high value for λ > `10^0`.
* **Capacity Effect & Key Data Points:**
* **Plateau WHR Value:** Increases with capacity.
* **Panel A (capacity=8):** WHR plateaus at `~0.5`.
* **Panel B (capacity=64):** WHR plateaus at `~0.95`.
* **Panel C (capacity=128):** WHR plateaus at `~0.95` (similar to B).
* **Transition Region:** The light blue shaded area highlights the λ region (`~0.03` to `~0.3`) where the most dramatic changes in MFPT and WHR occur. This region is present in B and C but not explicitly shaded in A.
* **MFPT Minimum:** The lowest point of the MFPT curve occurs within or just after the shaded transition region, reaching values as low as `~0.1` in panels B and C.
### Key Observations
1. **Inverse Relationship:** There is a clear inverse relationship between MFPT and WHR. As λ increases through the critical transition region, MFPT collapses while WHR surges.
2. **Phase Transition:** The data suggests a phase transition in model behavior controlled by λ. Low λ favors high MFPT/low WHR and separated entropy metrics. High λ favors low MFPT/high WHR and converged entropy metrics.
3. **Capacity Saturation:** Increasing capacity from 8 to 64 has a dramatic effect on the final WHR plateau (0.5 to ~0.95). Increasing further to 128 shows minimal additional gain, suggesting a saturation point.
4. **Metric Convergence:** At high λ, both entropy metrics (cross-entropy and path-entropy) converge to the same high value (`~1.4`), indicating a loss of distinction between them in the high-regularization regime.
### Interpretation
This figure likely illustrates the effect of a regularization strength parameter (λ) on the optimization dynamics and final solution quality of a machine learning model, possibly in the context of loss landscape analysis or generalization.
* **What the data suggests:** The parameter λ acts as a control knob for a trade-off. At low λ (weak regularization), the model finds solutions with high "Mean First Passage Time" (MFPT, possibly related to optimization difficulty or stability) but low "WHR" (a performance or generalization metric). As λ increases, the model undergoes a rapid transition: optimization becomes faster/easier (MFPT drops) and the solution quality improves dramatically (WHR rises), until both metrics plateau.
* **How elements relate:** The top plots show that this transition is accompanied by a change in the entropy of the solution path. The convergence of cross-entropy and path-entropy at high λ suggests the regularization forces the model into a simpler, more constrained region of the solution space. The capacity effect shows that larger models can achieve better final performance (higher WHR plateau) but undergo a similar transition.
* **Notable Anomalies:** The sharp, almost discontinuous drop in MFPT is striking. The light blue shaded region in B and C explicitly marks this critical λ window where the model's behavior fundamentally changes. The fact that the path-entropy starts higher for larger capacities (B, C vs. A) may indicate that larger models begin in a more complex state before regularization simplifies them.
**In summary, the figure demonstrates a regularization-induced phase transition in model behavior, where increasing λ past a critical threshold simultaneously simplifies the solution (converging entropies), accelerates optimization (lower MFPT), and improves performance (higher WHR), with the benefit scaling with model capacity up to a point.**
DECODING INTELLIGENCE...