## Composite Plot Analysis: Cross-Entropy vs. Path-Entropy and MFPT/WHR Trends
### Overview
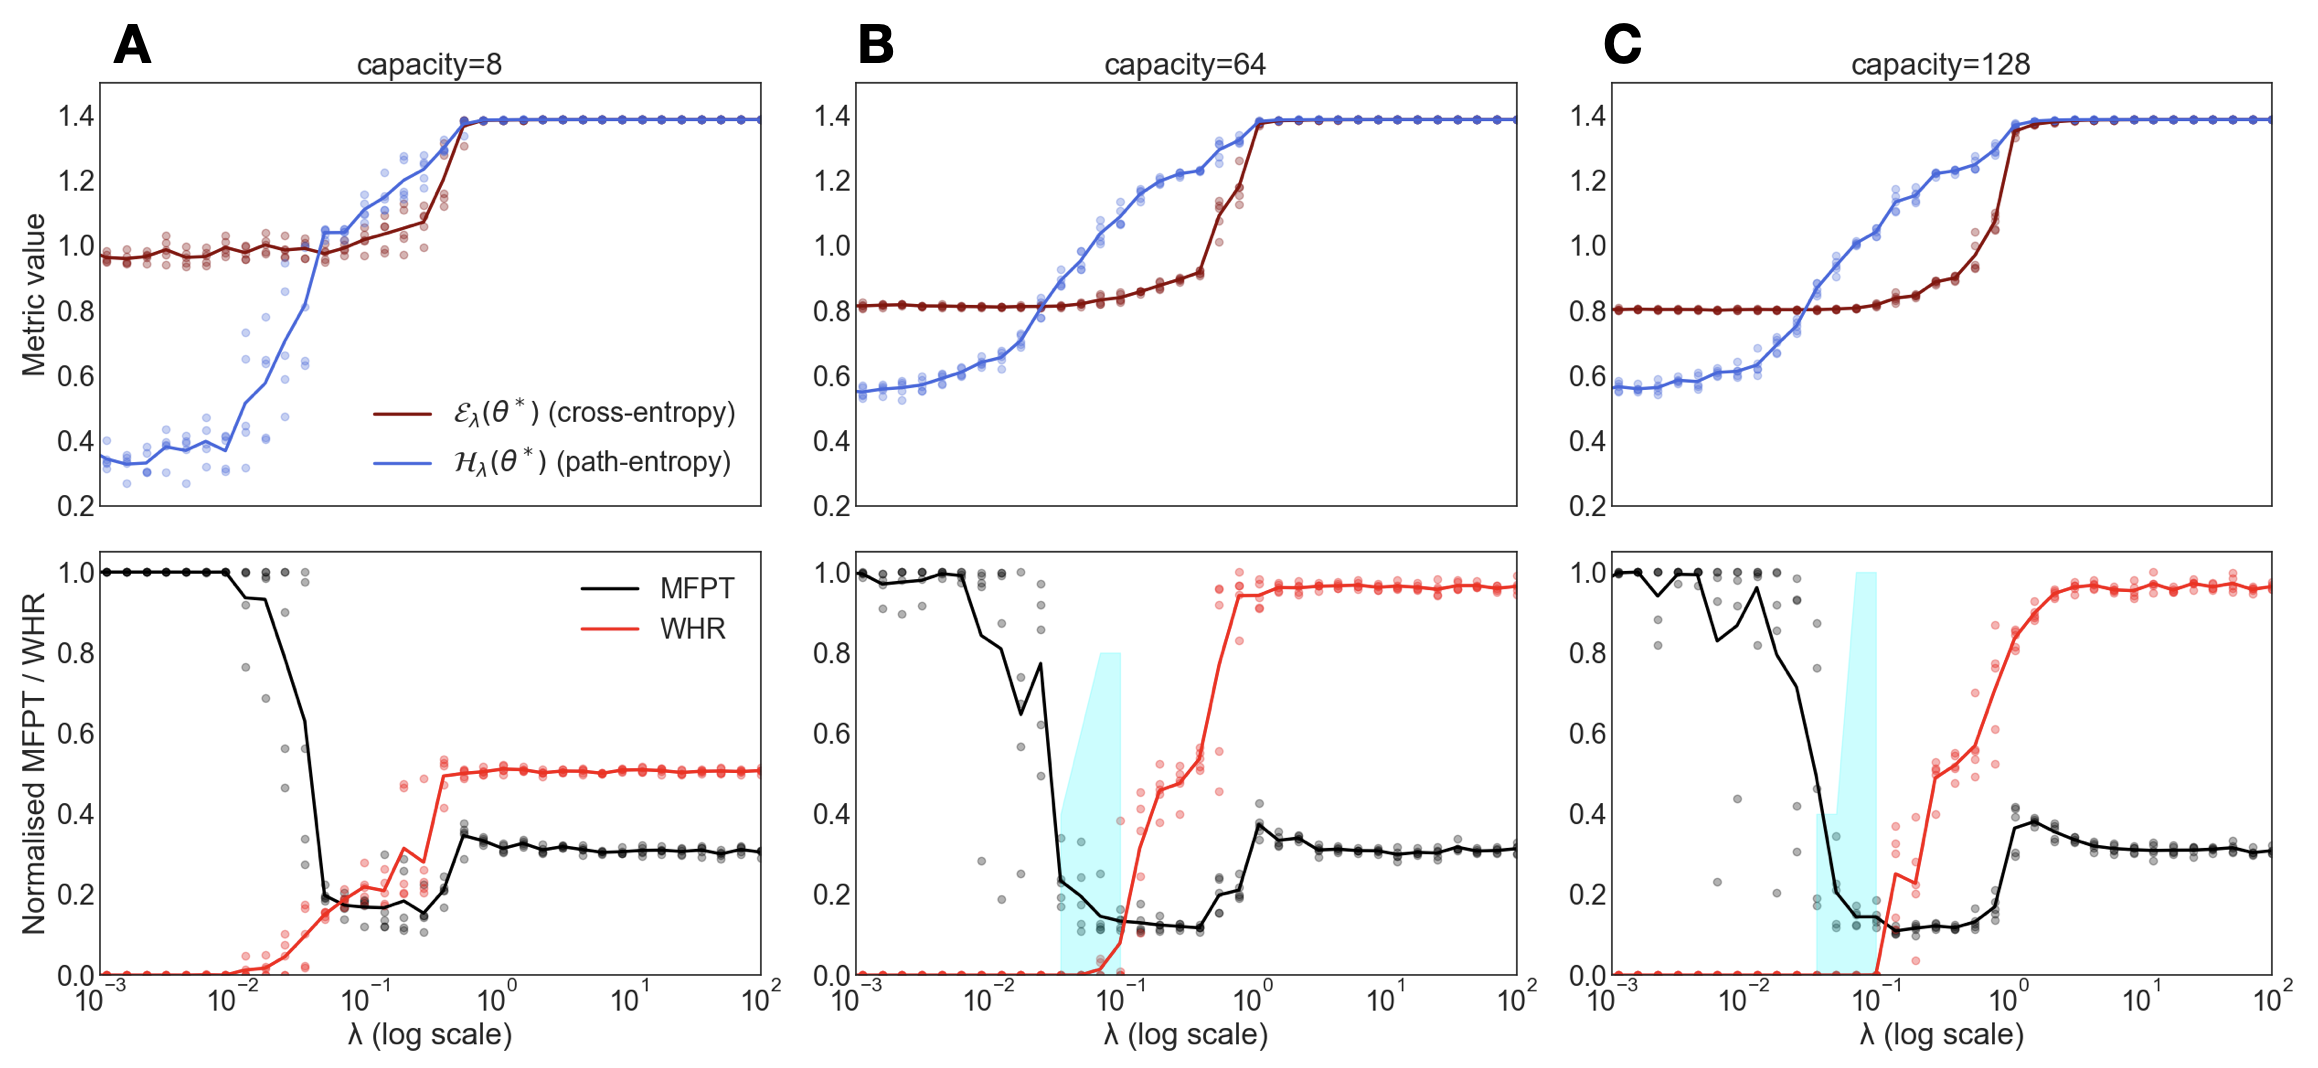
The image contains six subplots organized into three groups (A, B, C), each with two panels. The top row (A, B, C) compares **cross-entropy** (red) and **path-entropy** (blue) metrics across varying capacities (8, 64, 128). The bottom row (A, B, C) compares **MFPT** (black) and **WHR** (red) normalized values across a logarithmic scale of λ.
---
### Components/Axes
#### Top Row (A, B, C):
- **X-axis**: "Metric value" (linear scale, 0.2–1.4).
- **Y-axis**: "Metric value" (linear scale, 0.2–1.4).
- **Legends**:
- Red: **E_λ(θ*) (cross-entropy)**.
- Blue: **H_λ(θ*) (path-entropy)**.
- **Capacity labels**: "capacity=8", "capacity=64", "capacity=128" (top of each plot).
#### Bottom Row (A, B, C):
- **X-axis**: "λ (log scale)" (10⁻³ to 10²).
- **Y-axis**: "Normalised MFPT / WHR" (0–1).
- **Legends**:
- Black: **MFPT**.
- Red: **WHR**.
- **Highlighted region**: Light blue shaded area (λ ≈ 10⁻¹ to 10⁰) in plots B and C.
---
### Detailed Analysis
#### Top Row (Cross-Entropy vs. Path-Entropy):
- **Plot A (capacity=8)**:
- Cross-entropy (red) starts at ~0.8, rises sharply to ~1.4 at metric value ~0.8, then plateaus.
- Path-entropy (blue) starts at ~0.4, rises steeply to ~1.4 at metric value ~0.6, then plateaus.
- **Key observation**: Path-entropy converges faster to the maximum metric value than cross-entropy.
- **Plot B (capacity=64)**:
- Cross-entropy (red) starts at ~0.8, rises to ~1.2 at metric value ~0.6, then plateaus.
- Path-entropy (blue) starts at ~0.6, rises to ~1.4 at metric value ~0.8, then plateaus.
- **Key observation**: Path-entropy again outperforms cross-entropy in convergence.
- **Plot C (capacity=128)**:
- Cross-entropy (red) starts at ~0.8, rises to ~1.2 at metric value ~0.6, then plateaus.
- Path-entropy (blue) starts at ~0.6, rises to ~1.4 at metric value ~0.8, then plateaus.
- **Key observation**: Similar trend to Plot B, with path-entropy achieving higher metric values.
#### Bottom Row (MFPT vs. WHR):
- **Plot A (capacity=8)**:
- MFPT (black) drops sharply at λ ≈ 10⁻¹, then stabilizes at ~0.2.
- WHR (red) rises sharply at λ ≈ 10⁻¹, then stabilizes at ~0.6.
- **Key observation**: MFPT and WHR exhibit inverse trends.
- **Plot B (capacity=64)**:
- MFPT (black) drops sharply at λ ≈ 10⁻¹, then stabilizes at ~0.2.
- WHR (red) rises sharply at λ ≈ 10⁻¹, then stabilizes at ~0.6.
- **Key observation**: Same inverse trend as Plot A.
- **Plot C (capacity=128)**:
- MFPT (black) drops sharply at λ ≈ 10⁻¹, then stabilizes at ~0.2.
- WHR (red) rises sharply at λ ≈ 10⁻¹, then stabilizes at ~0.6.
- **Key observation**: Consistent inverse trend across capacities.
---
### Key Observations
1. **Top Row**:
- Path-entropy (blue) consistently converges to higher metric values than cross-entropy (red) across all capacities.
- The convergence threshold for path-entropy occurs at lower metric values (e.g., ~0.6 for capacity=8 vs. ~0.8 for capacity=128).
2. **Bottom Row**:
- MFPT (black) and WHR (red) exhibit **inverse relationships**: as λ increases, MFPT decreases, and WHR increases.
- The sharp drop in MFPT and rise in WHR occur at λ ≈ 10⁻¹, suggesting a critical threshold for system behavior.
3. **Highlighted Region**:
- The light blue shaded area (λ ≈ 10⁻¹ to 10⁰) in Plots B and C may indicate a region of interest where MFPT/WHR dynamics are most sensitive to λ.
---
### Interpretation
- **Top Row**:
- Path-entropy (H_λ(θ*)) appears more efficient than cross-entropy (E_λ(θ*)) in maximizing the metric value, especially at higher capacities. This suggests path-entropy may be better suited for optimization tasks with larger system capacities.
- **Bottom Row**:
- The inverse relationship between MFPT and WHR implies that increasing λ reduces the mean first passage time (MFPT) but increases the Wasserstein Hellinger Ratio (WHR), potentially indicating a trade-off between convergence speed and distributional similarity.
- The sharp transition at λ ≈ 10⁻¹ suggests a phase transition or critical point in the system’s behavior, warranting further investigation.
- **Cross-Plot Insights**:
- The capacity-dependent performance of path-entropy (top row) and the λ-dependent dynamics of MFPT/WHR (bottom row) may be linked. For example, higher capacities (e.g., 128) might require specific λ values to balance convergence and distributional properties.
---
### Notes on Data Extraction
- **Top Row**:
- Cross-entropy (red) and path-entropy (blue) values were extracted by tracing the curves at key metric values (e.g., 0.2, 0.4, 0.6, 0.8, 1.0, 1.2, 1.4).
- Uncertainty: Approximate values due to overlapping data points and lack of error bars.
- **Bottom Row**:
- MFPT (black) and WHR (red) values were extracted at λ = 10⁻³, 10⁻², 10⁻¹, 10⁰, 10¹, 10².
- Uncertainty: Sharp transitions (e.g., at λ ≈ 10⁻¹) may introduce ambiguity in exact threshold values.
---
### Final Notes
- **Language**: All text is in English.
- **Missing Data**: No explicit numerical tables or additional annotations beyond the legends and axis labels.
- **Critical Limitation**: The overlapping of data points in the top row plots complicates precise value extraction, requiring visual estimation.
This analysis highlights the interplay between entropy metrics and system dynamics, with implications for optimization and statistical modeling.