\n
## Line Chart: Accuracy vs. Sample Size
### Overview
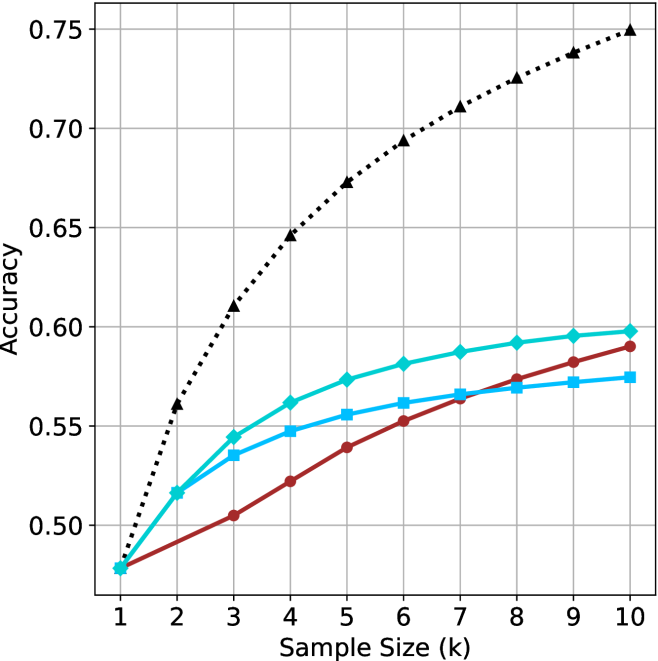
The image presents a line chart illustrating the relationship between sample size and accuracy. Four distinct data series are plotted, each representing a different model or condition. The x-axis represents the sample size in thousands (k), ranging from 1 to 10. The y-axis represents accuracy, ranging from 0.50 to 0.75. The chart displays a clear trend of increasing accuracy with increasing sample size for all series, but at varying rates.
### Components/Axes
* **X-axis Label:** "Sample Size (k)"
* **Y-axis Label:** "Accuracy"
* **X-axis Scale:** Linear, from 1 to 10, with increments of 1.
* **Y-axis Scale:** Linear, from 0.50 to 0.75, with increments of 0.05.
* **Data Series 1 (Black Dotted Line):** Represents the highest accuracy growth.
* **Data Series 2 (Cyan Line):** Shows moderate accuracy growth.
* **Data Series 3 (Blue Line):** Shows moderate accuracy growth, slightly lower than the cyan line.
* **Data Series 4 (Red Line):** Shows the slowest accuracy growth.
* **Gridlines:** Present to aid in reading values.
### Detailed Analysis
Let's analyze each data series individually:
* **Black Dotted Line:** This line exhibits the steepest positive slope, indicating the fastest increase in accuracy with sample size.
* At Sample Size = 1k, Accuracy ≈ 0.52
* At Sample Size = 2k, Accuracy ≈ 0.58
* At Sample Size = 3k, Accuracy ≈ 0.61
* At Sample Size = 4k, Accuracy ≈ 0.65
* At Sample Size = 5k, Accuracy ≈ 0.68
* At Sample Size = 6k, Accuracy ≈ 0.70
* At Sample Size = 7k, Accuracy ≈ 0.71
* At Sample Size = 8k, Accuracy ≈ 0.72
* At Sample Size = 9k, Accuracy ≈ 0.73
* At Sample Size = 10k, Accuracy ≈ 0.74
* **Cyan Line:** This line shows a moderate increase in accuracy.
* At Sample Size = 1k, Accuracy ≈ 0.49
* At Sample Size = 2k, Accuracy ≈ 0.53
* At Sample Size = 3k, Accuracy ≈ 0.55
* At Sample Size = 4k, Accuracy ≈ 0.56
* At Sample Size = 5k, Accuracy ≈ 0.57
* At Sample Size = 6k, Accuracy ≈ 0.58
* At Sample Size = 7k, Accuracy ≈ 0.58
* At Sample Size = 8k, Accuracy ≈ 0.59
* At Sample Size = 9k, Accuracy ≈ 0.59
* At Sample Size = 10k, Accuracy ≈ 0.60
* **Blue Line:** This line shows a moderate increase in accuracy, slightly lower than the cyan line.
* At Sample Size = 1k, Accuracy ≈ 0.48
* At Sample Size = 2k, Accuracy ≈ 0.52
* At Sample Size = 3k, Accuracy ≈ 0.54
* At Sample Size = 4k, Accuracy ≈ 0.55
* At Sample Size = 5k, Accuracy ≈ 0.56
* At Sample Size = 6k, Accuracy ≈ 0.57
* At Sample Size = 7k, Accuracy ≈ 0.57
* At Sample Size = 8k, Accuracy ≈ 0.58
* At Sample Size = 9k, Accuracy ≈ 0.58
* At Sample Size = 10k, Accuracy ≈ 0.59
* **Red Line:** This line exhibits the slowest increase in accuracy.
* At Sample Size = 1k, Accuracy ≈ 0.47
* At Sample Size = 2k, Accuracy ≈ 0.50
* At Sample Size = 3k, Accuracy ≈ 0.52
* At Sample Size = 4k, Accuracy ≈ 0.53
* At Sample Size = 5k, Accuracy ≈ 0.54
* At Sample Size = 6k, Accuracy ≈ 0.55
* At Sample Size = 7k, Accuracy ≈ 0.55
* At Sample Size = 8k, Accuracy ≈ 0.56
* At Sample Size = 9k, Accuracy ≈ 0.57
* At Sample Size = 10k, Accuracy ≈ 0.58
### Key Observations
* All four data series demonstrate a positive correlation between sample size and accuracy.
* The black dotted line consistently outperforms the other three series across all sample sizes.
* The red line consistently underperforms the other three series across all sample sizes.
* The rate of accuracy improvement diminishes as the sample size increases for all series, suggesting diminishing returns.
### Interpretation
The chart suggests that increasing the sample size generally leads to improved accuracy for all models or conditions being tested. However, the magnitude of this improvement varies significantly. The black dotted line likely represents a model or condition that benefits most from larger sample sizes, potentially due to its complexity or sensitivity to data. Conversely, the red line represents a model or condition that is less affected by sample size, possibly indicating a simpler model or a more robust algorithm.
The diminishing returns observed at larger sample sizes suggest that there is a point beyond which increasing the sample size provides only marginal improvements in accuracy. This information is crucial for optimizing resource allocation and determining the appropriate sample size for achieving a desired level of accuracy. The chart could be used to inform decisions about data collection strategies and model selection. The differences in performance between the lines could be due to different algorithms, different feature sets, or different data preprocessing techniques. Further investigation would be needed to determine the underlying causes of these differences.