## Line Chart: Accuracy vs. Sample Size (k)
### Overview
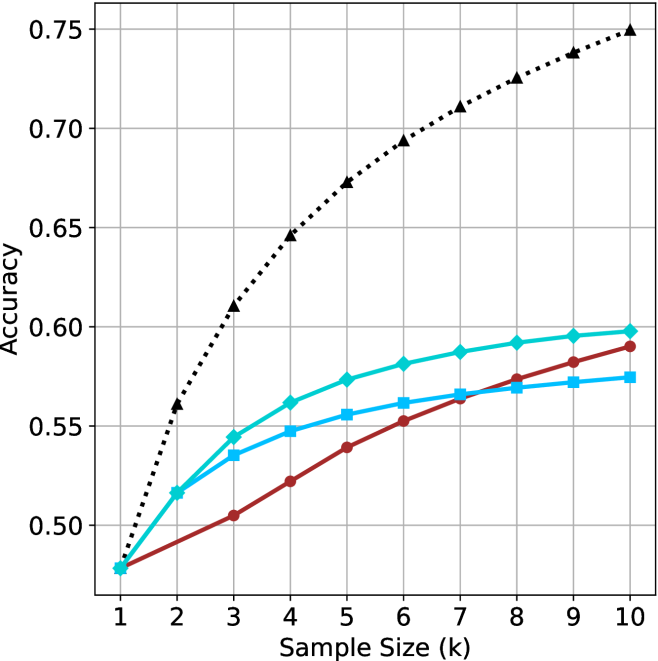
The chart displays three data series representing accuracy trends across sample sizes (k=1 to 10). A dotted black line (Random Guessing) shows a steep upward trend, while two solid lines (Model A in blue and Model B in red) exhibit gradual increases. All series originate at (1, 0.50) but diverge significantly by k=10.
### Components/Axes
- **X-axis**: "Sample Size (k)" with integer markers 1–10.
- **Y-axis**: "Accuracy" scaled from 0.50 to 0.75 in 0.05 increments.
- **Legend**: Top-right corner, associating:
- Black dotted line → "Random Guessing"
- Blue solid line → "Model A"
- Red solid line → "Model B"
### Detailed Analysis
1. **Random Guessing (Black Dotted Line)**:
- Starts at (1, 0.50) and increases linearly by ~0.05 per unit k.
- Reaches 0.75 at k=10 (exact values: 0.50, 0.55, 0.60, 0.65, 0.70, 0.75).
2. **Model A (Blue Solid Line)**:
- Starts at (1, 0.50) with gradual growth.
- Values: ~0.50 (k=1), 0.52 (k=2), 0.54 (k=3), 0.55 (k=4), 0.56 (k=5), 0.57 (k=6), 0.58 (k=7–10).
3. **Model B (Red Solid Line)**:
- Starts at (1, 0.50) with steeper growth than Model A.
- Values: ~0.50 (k=1), 0.51 (k=2), 0.53 (k=3), 0.55 (k=4), 0.57 (k=5), 0.58 (k=6), 0.59 (k=7–10).
### Key Observations
- **Unexpected Trend**: The "Random Guessing" line shows a linear increase, which contradicts typical expectations of random performance remaining constant.
- **Model Performance**: Both models improve with sample size, but Model B (red) outperforms Model A (blue) consistently after k=4.
- **Convergence**: All lines originate at the same point (k=1, 0.50), suggesting identical baseline performance at minimal sample sizes.
### Interpretation
The data suggests that increasing sample size improves accuracy for all methods, but the "Random Guessing" line’s upward trend is anomalous. This could indicate:
1. A data collection error (e.g., mislabeled "random" data).
2. A contextual factor where "random" guessing improves with more samples (unlikely in most scenarios).
3. A misinterpretation of the metric (e.g., accuracy defined differently for random guessing).
Models A and B demonstrate practical utility, with Model B achieving ~0.59 accuracy at k=10 compared to Model A’s ~0.58. However, both fall short of the "Random Guessing" line’s 0.75 at k=10, raising questions about the validity of the black line’s trajectory. Further investigation into the data generation process for the "Random Guessing" series is warranted.