## Line Graphs: Pattern Detection in Neural Network Heads
### Overview
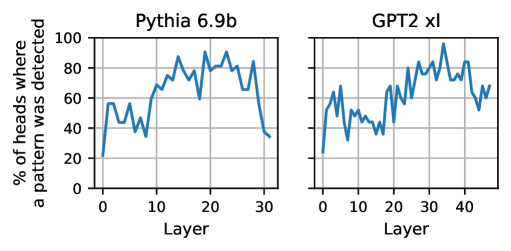
The image presents two line graphs comparing the percentage of heads where a pattern was detected across different layers of two neural network models: Pythia 6.9b and GPT2 xl. The x-axis represents the layer number, and the y-axis represents the percentage of heads where a pattern was detected.
### Components/Axes
**Left Graph (Pythia 6.9b):**
* **Title:** Pythia 6.9b
* **X-axis:** Layer, ranging from 0 to 30 in increments of 10.
* **Y-axis:** % of heads where a pattern was detected, ranging from 0 to 100 in increments of 20.
**Right Graph (GPT2 xl):**
* **Title:** GPT2 xl
* **X-axis:** Layer, ranging from 0 to 40 in increments of 10.
* **Y-axis:** % of heads where a pattern was detected, ranging from 0 to 100 in increments of 20.
**Shared Elements:**
* Both graphs have a grid for easier value estimation.
* Both graphs use a blue line to represent the data.
### Detailed Analysis
**Pythia 6.9b:**
* **Trend:** The line starts at approximately 20% at layer 0, increases to approximately 60% by layer 5, fluctuates between 70% and 95% from layer 10 to layer 25, and then decreases to approximately 35% by layer 30.
* **Data Points (Approximate):**
* Layer 0: 20%
* Layer 5: 60%
* Layer 15: 80%
* Layer 20: 90%
* Layer 25: 80%
* Layer 30: 35%
**GPT2 xl:**
* **Trend:** The line starts at approximately 25% at layer 0, increases to approximately 55% by layer 5, fluctuates between 40% and 60% from layer 5 to layer 15, then increases to fluctuate between 70% and 90% from layer 25 to layer 45.
* **Data Points (Approximate):**
* Layer 0: 25%
* Layer 5: 55%
* Layer 10: 45%
* Layer 20: 50%
* Layer 30: 75%
* Layer 40: 85%
### Key Observations
* Both models show an initial increase in pattern detection as the layer number increases.
* Pythia 6.9b exhibits a peak in pattern detection around layers 10-25, followed by a decrease.
* GPT2 xl shows a more gradual increase in pattern detection, with higher percentages in later layers compared to Pythia 6.9b.
* The range of layers differs between the two models (0-30 for Pythia 6.9b and 0-40 for GPT2 xl).
### Interpretation
The graphs illustrate how pattern detection varies across different layers in the Pythia 6.9b and GPT2 xl neural network models. The data suggests that different models may exhibit different patterns of feature extraction and representation across their layers. Pythia 6.9b seems to concentrate pattern detection in the middle layers, while GPT2 xl shows a more sustained increase in pattern detection towards the later layers. This could indicate differences in the models' architectures, training data, or learning strategies. The initial increase in both models likely reflects the initial layers learning basic features, while the later fluctuations may represent the extraction of more complex patterns. The decrease in pattern detection in the final layers of Pythia 6.9b could indicate a specialization or refinement of features in those layers.