\n
## Line Chart: Pattern Detection in Neural Network Layers
### Overview
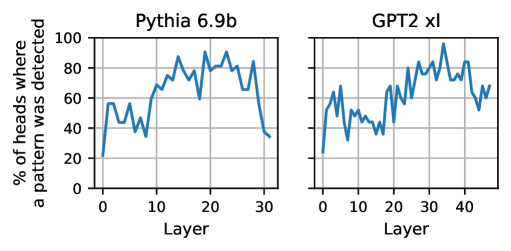
The image presents two line charts comparing pattern detection rates across layers in two different neural network models: Pythia 6.9b and GPT2 xl. The charts display the percentage of heads where a pattern was detected as a function of the layer number.
### Components/Axes
* **X-axis (Both Charts):** "Layer" - ranging from 0 to 30 for Pythia 6.9b and 0 to 40 for GPT2 xl. The scale is linear.
* **Y-axis (Both Charts):** "% of heads where a pattern was detected" - ranging from 0 to 100. The scale is linear.
* **Chart Titles:**
* Left Chart: "Pythia 6.9b"
* Right Chart: "GPT2 xl"
* **Data Series:** A single blue line for each chart representing the pattern detection rate.
* **Gridlines:** Both charts have a light gray grid to aid in reading values.
### Detailed Analysis
**Pythia 6.9b (Left Chart):**
The blue line starts at approximately 55% at layer 0, dips to around 40% at layer 1, then rises steadily to a peak of approximately 90% around layer 15. After layer 15, the line fluctuates between 70% and 90% until layer 25, after which it declines sharply to approximately 40% at layer 30.
* Layer 0: ~55%
* Layer 1: ~40%
* Layer 5: ~65%
* Layer 10: ~80%
* Layer 15: ~90%
* Layer 20: ~80%
* Layer 25: ~70%
* Layer 30: ~40%
**GPT2 xl (Right Chart):**
The blue line begins at approximately 65% at layer 0, dips to around 40% at layer 2, then rises to a peak of approximately 95% around layer 30. After layer 30, the line declines to approximately 60% at layer 40.
* Layer 0: ~65%
* Layer 2: ~40%
* Layer 5: ~60%
* Layer 10: ~70%
* Layer 20: ~80%
* Layer 30: ~95%
* Layer 35: ~85%
* Layer 40: ~60%
### Key Observations
* Both models show an initial dip in pattern detection rate followed by a rise.
* GPT2 xl exhibits a higher peak detection rate (around 95%) compared to Pythia 6.9b (around 90%).
* Pythia 6.9b shows a more pronounced decline in pattern detection rate towards the end of its layers.
* GPT2 xl maintains a relatively higher detection rate across a wider range of layers.
### Interpretation
The charts suggest that pattern detection capabilities develop in the initial layers of both neural networks, reaching a peak performance at a certain layer depth. The subsequent decline in detection rate in Pythia 6.9b could indicate overfitting or a loss of generalization ability in the later layers. The more gradual decline in GPT2 xl suggests better robustness or a different learning dynamic. The higher peak detection rate in GPT2 xl may indicate a greater capacity for identifying complex patterns. The differences in the curves could be attributed to variations in model architecture, training data, or training procedures. The data suggests that the optimal layer depth for pattern detection varies between the two models. The initial dip in both charts could represent a period of adjustment or feature extraction before meaningful patterns emerge.