## Line Graphs: Pattern Detection Across Layers in Pythia 6.9b and GPT2 xl
### Overview
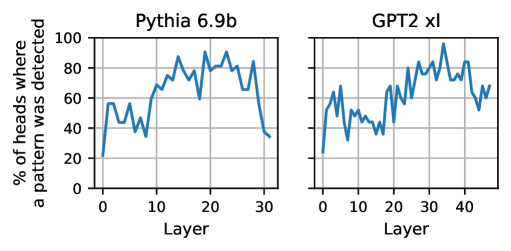
The image contains two side-by-side line graphs comparing the percentage of pattern detection across layers in two language models: **Pythia 6.9b** (left) and **GPT2 xl** (right). Both graphs plot the y-axis as "% of pattern where a pattern was detected" (0–100%) and the x-axis as "Layer" (0–30 for Pythia, 0–40 for GPT2). The lines exhibit fluctuating trends with notable peaks and troughs.
---
### Components/Axes
- **Left Graph (Pythia 6.9b)**:
- **Title**: "Pythia 6.9b" (top-center).
- **X-axis**: "Layer" (0–30, increments of 10).
- **Y-axis**: "% of pattern where a pattern was detected" (0–100%, increments of 20).
- **Line**: Blue, fluctuating, with approximate values:
- Layer 0: ~20%
- Layer 10: ~60%
- Layer 20: ~80%
- Layer 30: ~40%
- **Right Graph (GPT2 xl)**:
- **Title**: "GPT2 xl" (top-center).
- **X-axis**: "Layer" (0–40, increments of 10).
- **Y-axis**: Same as left graph.
- **Line**: Blue, fluctuating, with approximate values:
- Layer 0: ~20%
- Layer 10: ~50%
- Layer 20: ~70%
- Layer 30: ~80%
- Layer 40: ~60%
---
### Detailed Analysis
- **Pythia 6.9b**:
- The line starts at ~20% (Layer 0), rises sharply to ~60% by Layer 10, peaks at ~80% near Layer 20, then declines to ~40% by Layer 30.
- Notable volatility: Sharp drops (e.g., Layer 15 to 20) and irregular fluctuations.
- **GPT2 xl**:
- The line begins at ~20% (Layer 0), increases to ~50% by Layer 10, rises to ~70% at Layer 20, peaks at ~80% near Layer 30, then drops to ~60% by Layer 40.
- More sustained growth compared to Pythia, with fewer abrupt declines.
---
### Key Observations
1. **Pythia 6.9b**:
- Pattern detection peaks midway (Layer 20) and declines sharply afterward.
- Early layers (0–10) show rapid improvement, followed by instability.
2. **GPT2 xl**:
- Pattern detection grows more gradually, peaking later (Layer 30).
- Maintains higher values in later layers (30–40) compared to Pythia.
3. **Model Differences**:
- GPT2 xl has more layers (40 vs. 30) and exhibits steadier growth.
- Pythia’s performance drops significantly in deeper layers, suggesting potential overfitting or diminishing returns.
---
### Interpretation
The graphs suggest that **GPT2 xl** maintains stronger pattern detection capabilities in deeper layers compared to **Pythia 6.9b**, which experiences a notable decline after Layer 20. This could indicate architectural differences: GPT2’s larger scale (40 layers) may better preserve pattern detection in later stages, while Pythia’s smaller architecture (30 layers) shows diminishing returns. The volatility in both models highlights the complexity of pattern representation across transformer layers, with GPT2’s design potentially offering more robustness for deeper contextual analysis.