## Chart: Benchmark MATH500
### Overview
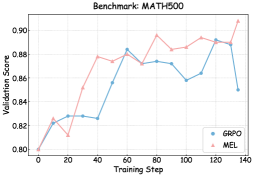
The image is a line chart comparing the validation scores of two models, GRPO and MEL, over training steps. The chart shows how the validation scores change as the models are trained.
### Components/Axes
* **Title:** Benchmark: MATH500
* **X-axis:** Training Step, ranging from 0 to 140 in increments of 20.
* **Y-axis:** Validation Score, ranging from 0.80 to 0.90 in increments of 0.02.
* **Legend:** Located in the bottom-right corner.
* GRPO (blue line with circle markers)
* MEL (pink line with triangle markers)
### Detailed Analysis
* **GRPO (blue line):**
* Starts at approximately 0.80 at training step 0.
* Increases to approximately 0.83 at training step 20.
* Slightly decreases to approximately 0.825 at training step 40.
* Increases to approximately 0.88 at training step 60.
* Slightly decreases to approximately 0.87 at training step 80.
* Decreases to approximately 0.87 at training step 100.
* Decreases to approximately 0.86 at training step 120.
* Increases to approximately 0.89 at training step 140.
* **MEL (pink line):**
* Starts at approximately 0.80 at training step 0.
* Increases to approximately 0.83 at training step 20.
* Increases to approximately 0.88 at training step 40.
* Slightly decreases to approximately 0.875 at training step 60.
* Increases to approximately 0.895 at training step 80.
* Slightly decreases to approximately 0.885 at training step 100.
* Slightly increases to approximately 0.89 at training step 120.
* Increases to approximately 0.905 at training step 140.
### Key Observations
* Both models start with the same validation score.
* The MEL model generally has a higher validation score than the GRPO model after the initial training steps.
* Both models show fluctuations in validation scores during training.
* The MEL model shows a more consistent upward trend overall.
### Interpretation
The chart compares the performance of two models, GRPO and MEL, on the MATH500 benchmark. The validation scores indicate how well the models generalize to unseen data during training. The MEL model appears to perform slightly better than the GRPO model, achieving higher validation scores throughout most of the training process. The fluctuations in validation scores suggest that both models experience some instability during training, but the MEL model seems to recover more effectively. The final validation scores at training step 140 suggest that the MEL model has a slightly better generalization capability on the MATH500 benchmark.