## Line Graph: Relationship Between Number of Layers and Log P_AR^10 Difference
### Overview
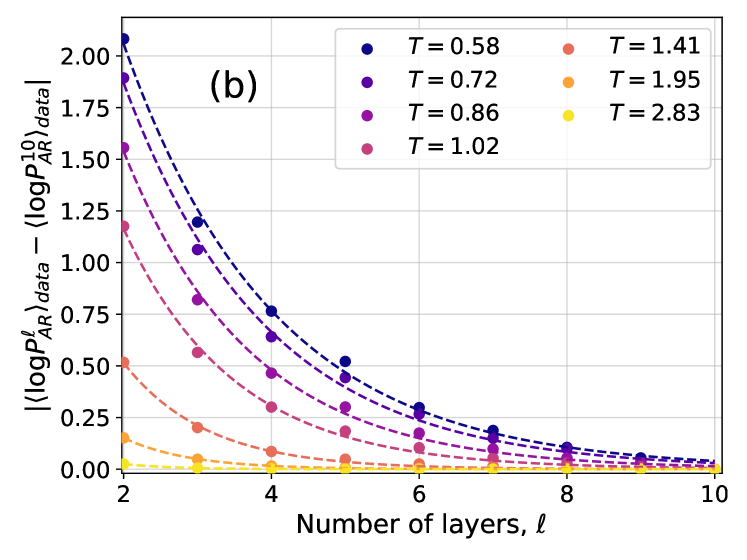
The graph illustrates the relationship between the number of layers (ℓ) and the absolute difference in logarithmic values of ⟨log P_AR^10⟩_data for various temperature (T) conditions. Six distinct data series are plotted, each corresponding to a specific T value, with trends showing how the difference evolves as the number of layers increases from 2 to 10.
### Components/Axes
- **X-axis**: "Number of layers, ℓ" (integer values from 2 to 10).
- **Y-axis**: "|⟨log P_AR^10⟩_data − ⟨log P_AR^10⟩_data|" (logarithmic scale, ranging from 0.00 to 2.00).
- **Legend**: Located in the top-right corner, mapping six T values to colors:
- **T = 0.58** (dark blue, solid circles)
- **T = 0.72** (purple, solid circles)
- **T = 0.86** (magenta, solid circles)
- **T = 1.02** (pink, solid circles)
- **T = 1.41** (orange, solid circles)
- **T = 1.95** (yellow, solid circles)
- **T = 2.83** (red, solid circles)
- **Line Style**: All lines are dashed, with markers (circles) at each data point.
### Detailed Analysis
1. **T = 0.58 (dark blue)**:
- Starts at ~2.00 for ℓ = 2, decreasing sharply to ~0.05 by ℓ = 10.
- Steepest decline among all series.
2. **T = 0.72 (purple)**:
- Begins at ~1.80 for ℓ = 2, dropping to ~0.10 by ℓ = 10.
- Intermediate slope compared to other series.
3. **T = 0.86 (magenta)**:
- Initial value ~1.60 at ℓ = 2, decreasing to ~0.15 at ℓ = 10.
- Moderate decline rate.
4. **T = 1.02 (pink)**:
- Starts at ~1.40 for ℓ = 2, falling to ~0.20 at ℓ = 10.
- Slower decline than lower T values.
5. **T = 1.41 (orange)**:
- Begins at ~0.50 for ℓ = 2, dropping to ~0.05 at ℓ = 10.
- Shallow slope, minimal change across layers.
6. **T = 1.95 (yellow)**:
- Starts at ~0.30 for ℓ = 2, decreasing to ~0.02 at ℓ = 10.
- Very gradual decline.
7. **T = 2.83 (red)**:
- Initial value ~0.10 at ℓ = 2, remaining near 0.00 for ℓ ≥ 4.
- Near-zero difference after ℓ = 4.
### Key Observations
- **Inverse Relationship**: Higher T values correlate with smaller absolute differences in ⟨log P_AR^10⟩_data.
- **Convergence**: All series approach zero as ℓ increases, with higher T values stabilizing faster.
- **Layer Sensitivity**: Lower T values (e.g., 0.58) exhibit stronger dependence on layer count, while higher T values (e.g., 2.83) show minimal layer-dependent variation.
- **Data Point Consistency**: All markers align precisely with their respective legend colors, confirming accurate series identification.
### Interpretation
The data suggests that temperature (T) modulates the sensitivity of ⟨log P_AR^10⟩_data to the number of layers. Lower T values amplify layer-dependent variations, while higher T values suppress these effects, potentially indicating a saturation or equilibrium state. The convergence of all series toward zero at higher layers implies that beyond a critical layer count (ℓ > 8), the system reaches a stable configuration where T has negligible impact. This could reflect a phase transition or critical threshold in the modeled system, where increasing layers homogenize the logarithmic differences regardless of T. The stark contrast between T = 0.58 (high sensitivity) and T = 2.83 (near-zero sensitivity) highlights T as a critical parameter governing system behavior.